IGNAL | Reporting Live

Are we winning? Now you know.

Every client asks the same question. Signal answers it on one screen: SEO, local, paid, calls, CRM and the dollars they turned into. Live, not monthly. Plain English, not a deck.

Demo data shown. Your dashboard shows your numbers.
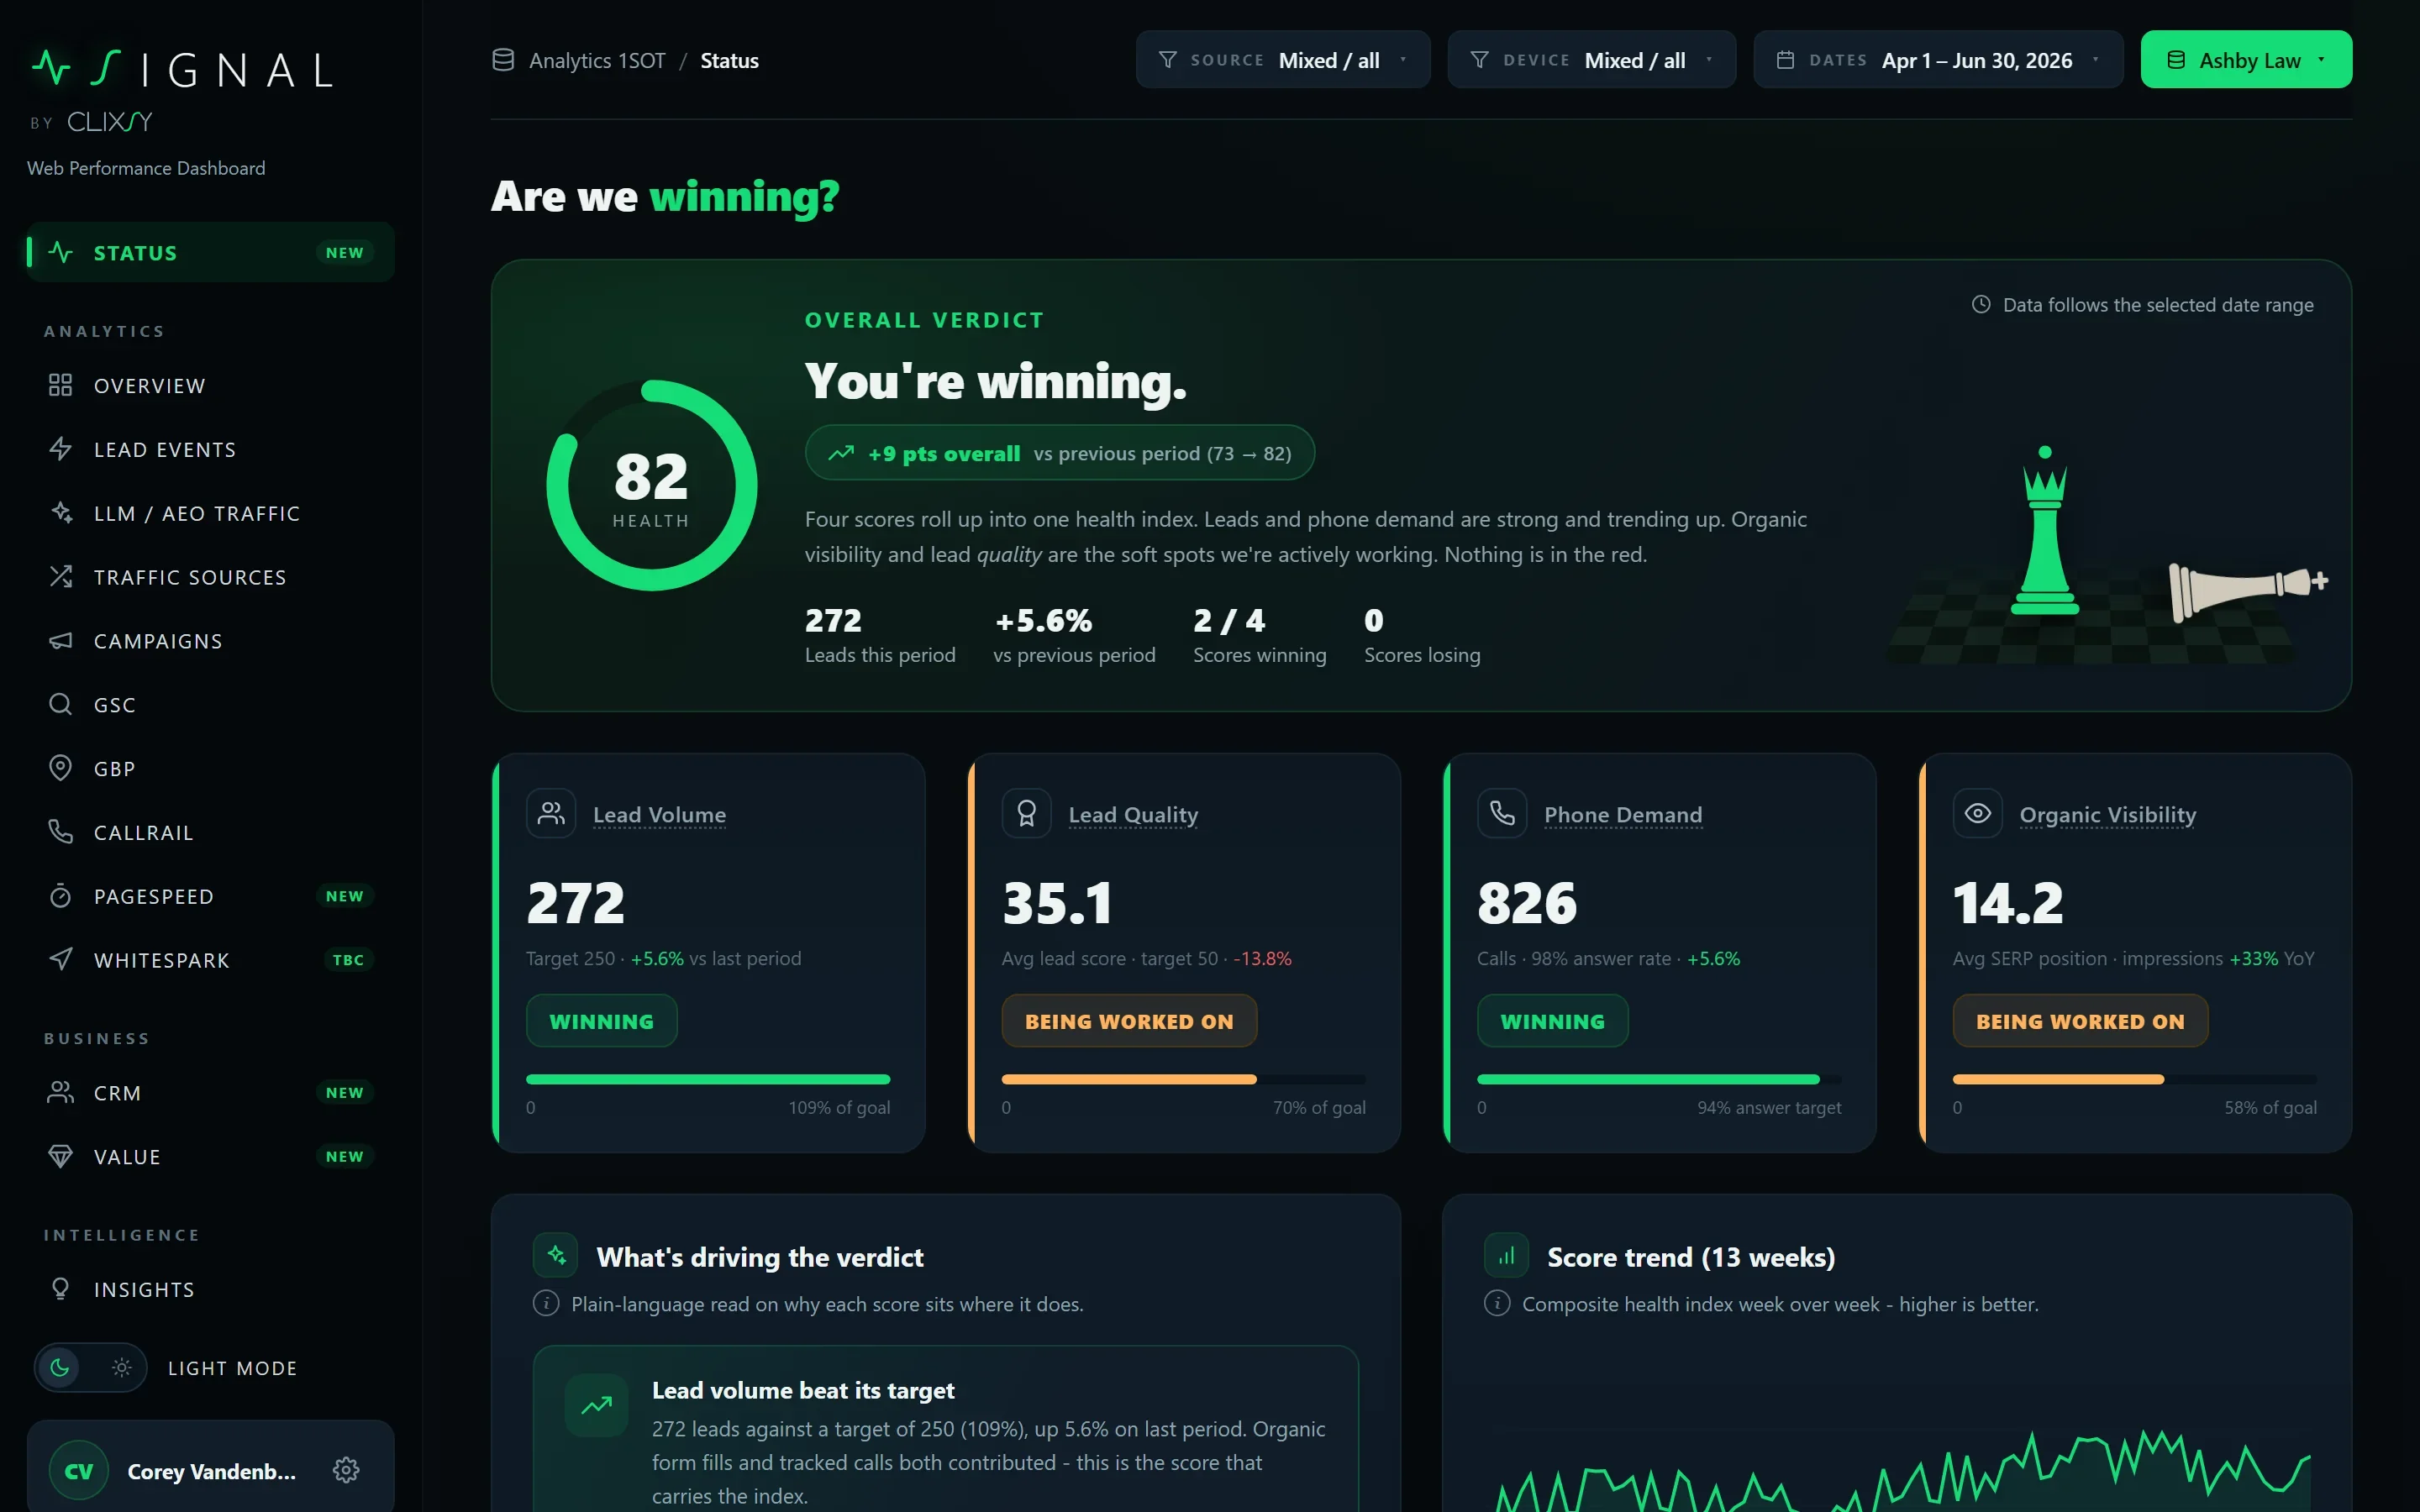
Signal | Status
Signal status page: the overall verdict reads You're winning, health index 82, four score cards for lead volume, lead quality, phone demand and organic visibility, and a 13-week score trend
Joined from GA4Search ConsoleCallRailGoogle Business ProfileBigQueryWhitesparkPageSpeed InsightsCRMBasecamp / ClickUp via MCPClixsy Script
Scope

14 viewsone screen, one login

Sources

10 sourcesjoined, not pasted

Cadence

Zero decksand zero waiting for one

Voice

Plain Englishwritten, then reviewed

Intelligence

What the data says. In sentences.

A rules layer finds the deltas that matter. A language model writes them up. A person reads it before it publishes. Wins, watch items and ideas, each one citing the panel it came from.

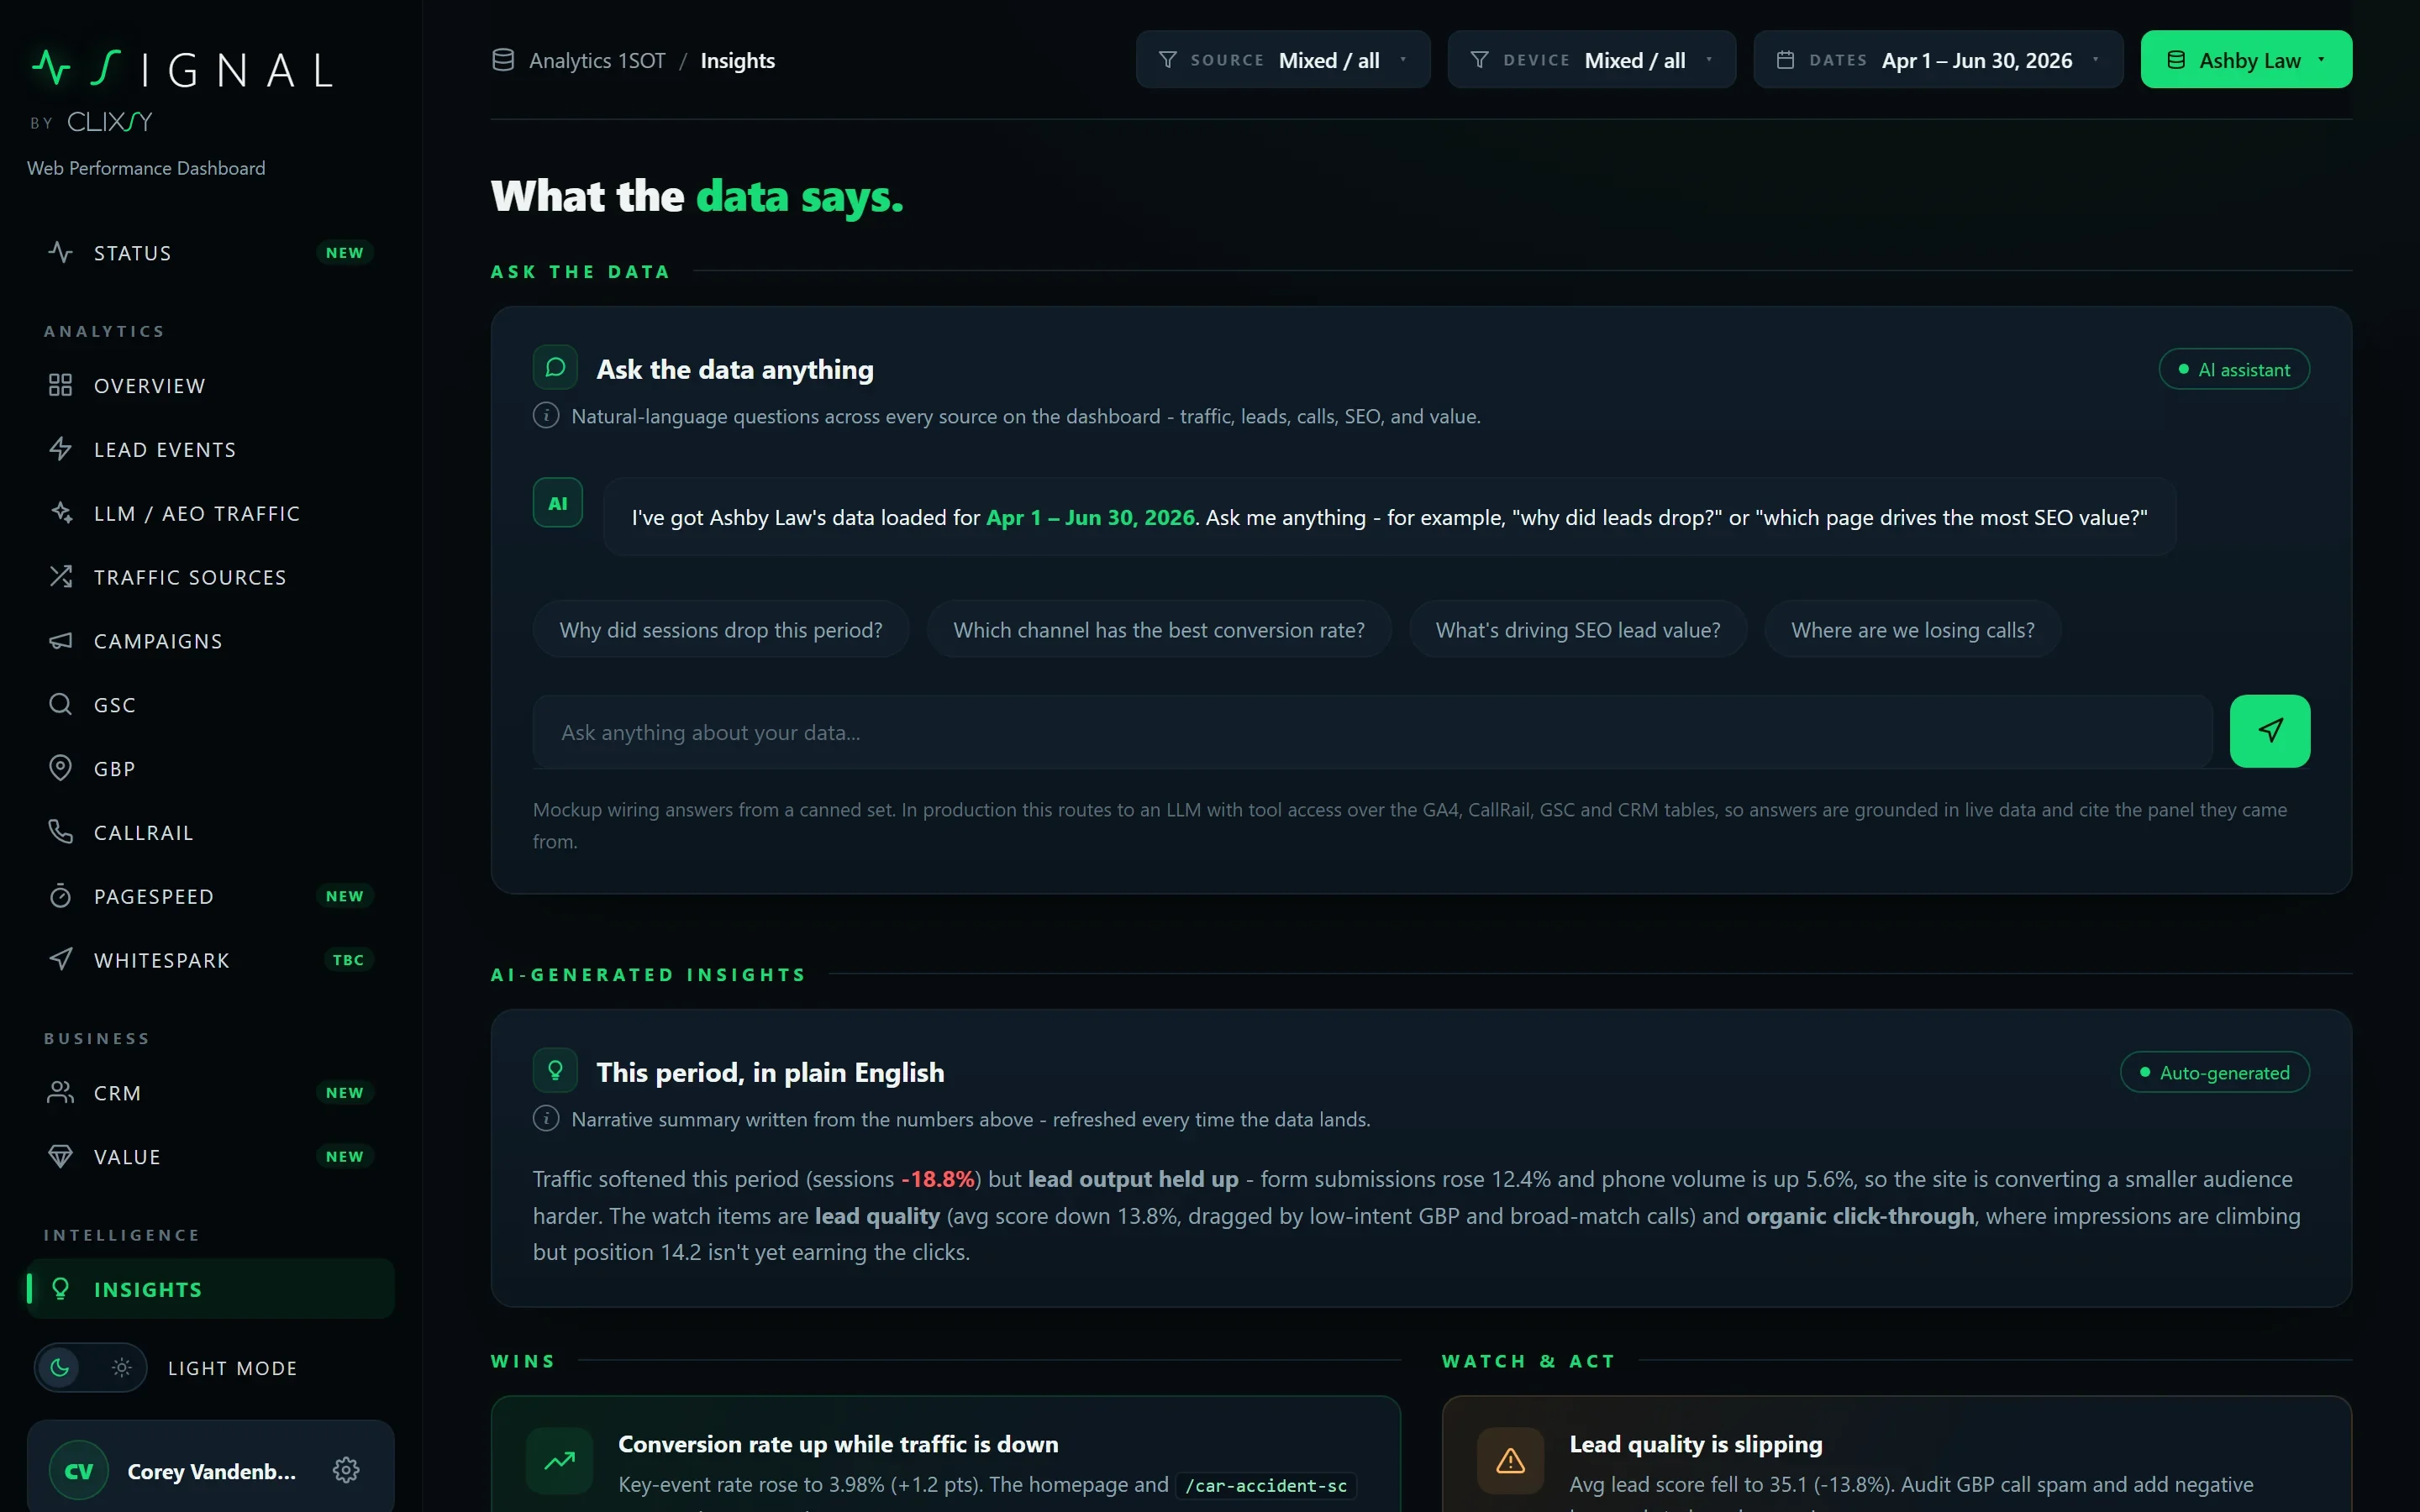
  • 01Ask the data anything. Natural-language questions across traffic, leads, calls, SEO and value, answered from the same tables the dashboard reads.
  • 02This period, in plain English. The narrative refreshes every time the data lands, not when someone gets round to it.
  • 03Wins and watch-and-act. Thresholded for significance, so a quiet week reads as a quiet week.
Signal | Insights
Signal insights page: an Ask the data anything assistant with suggested questions, and an auto-generated plain-English summary of the period above wins and watch-and-act cards
Business

What is this engagement worth?

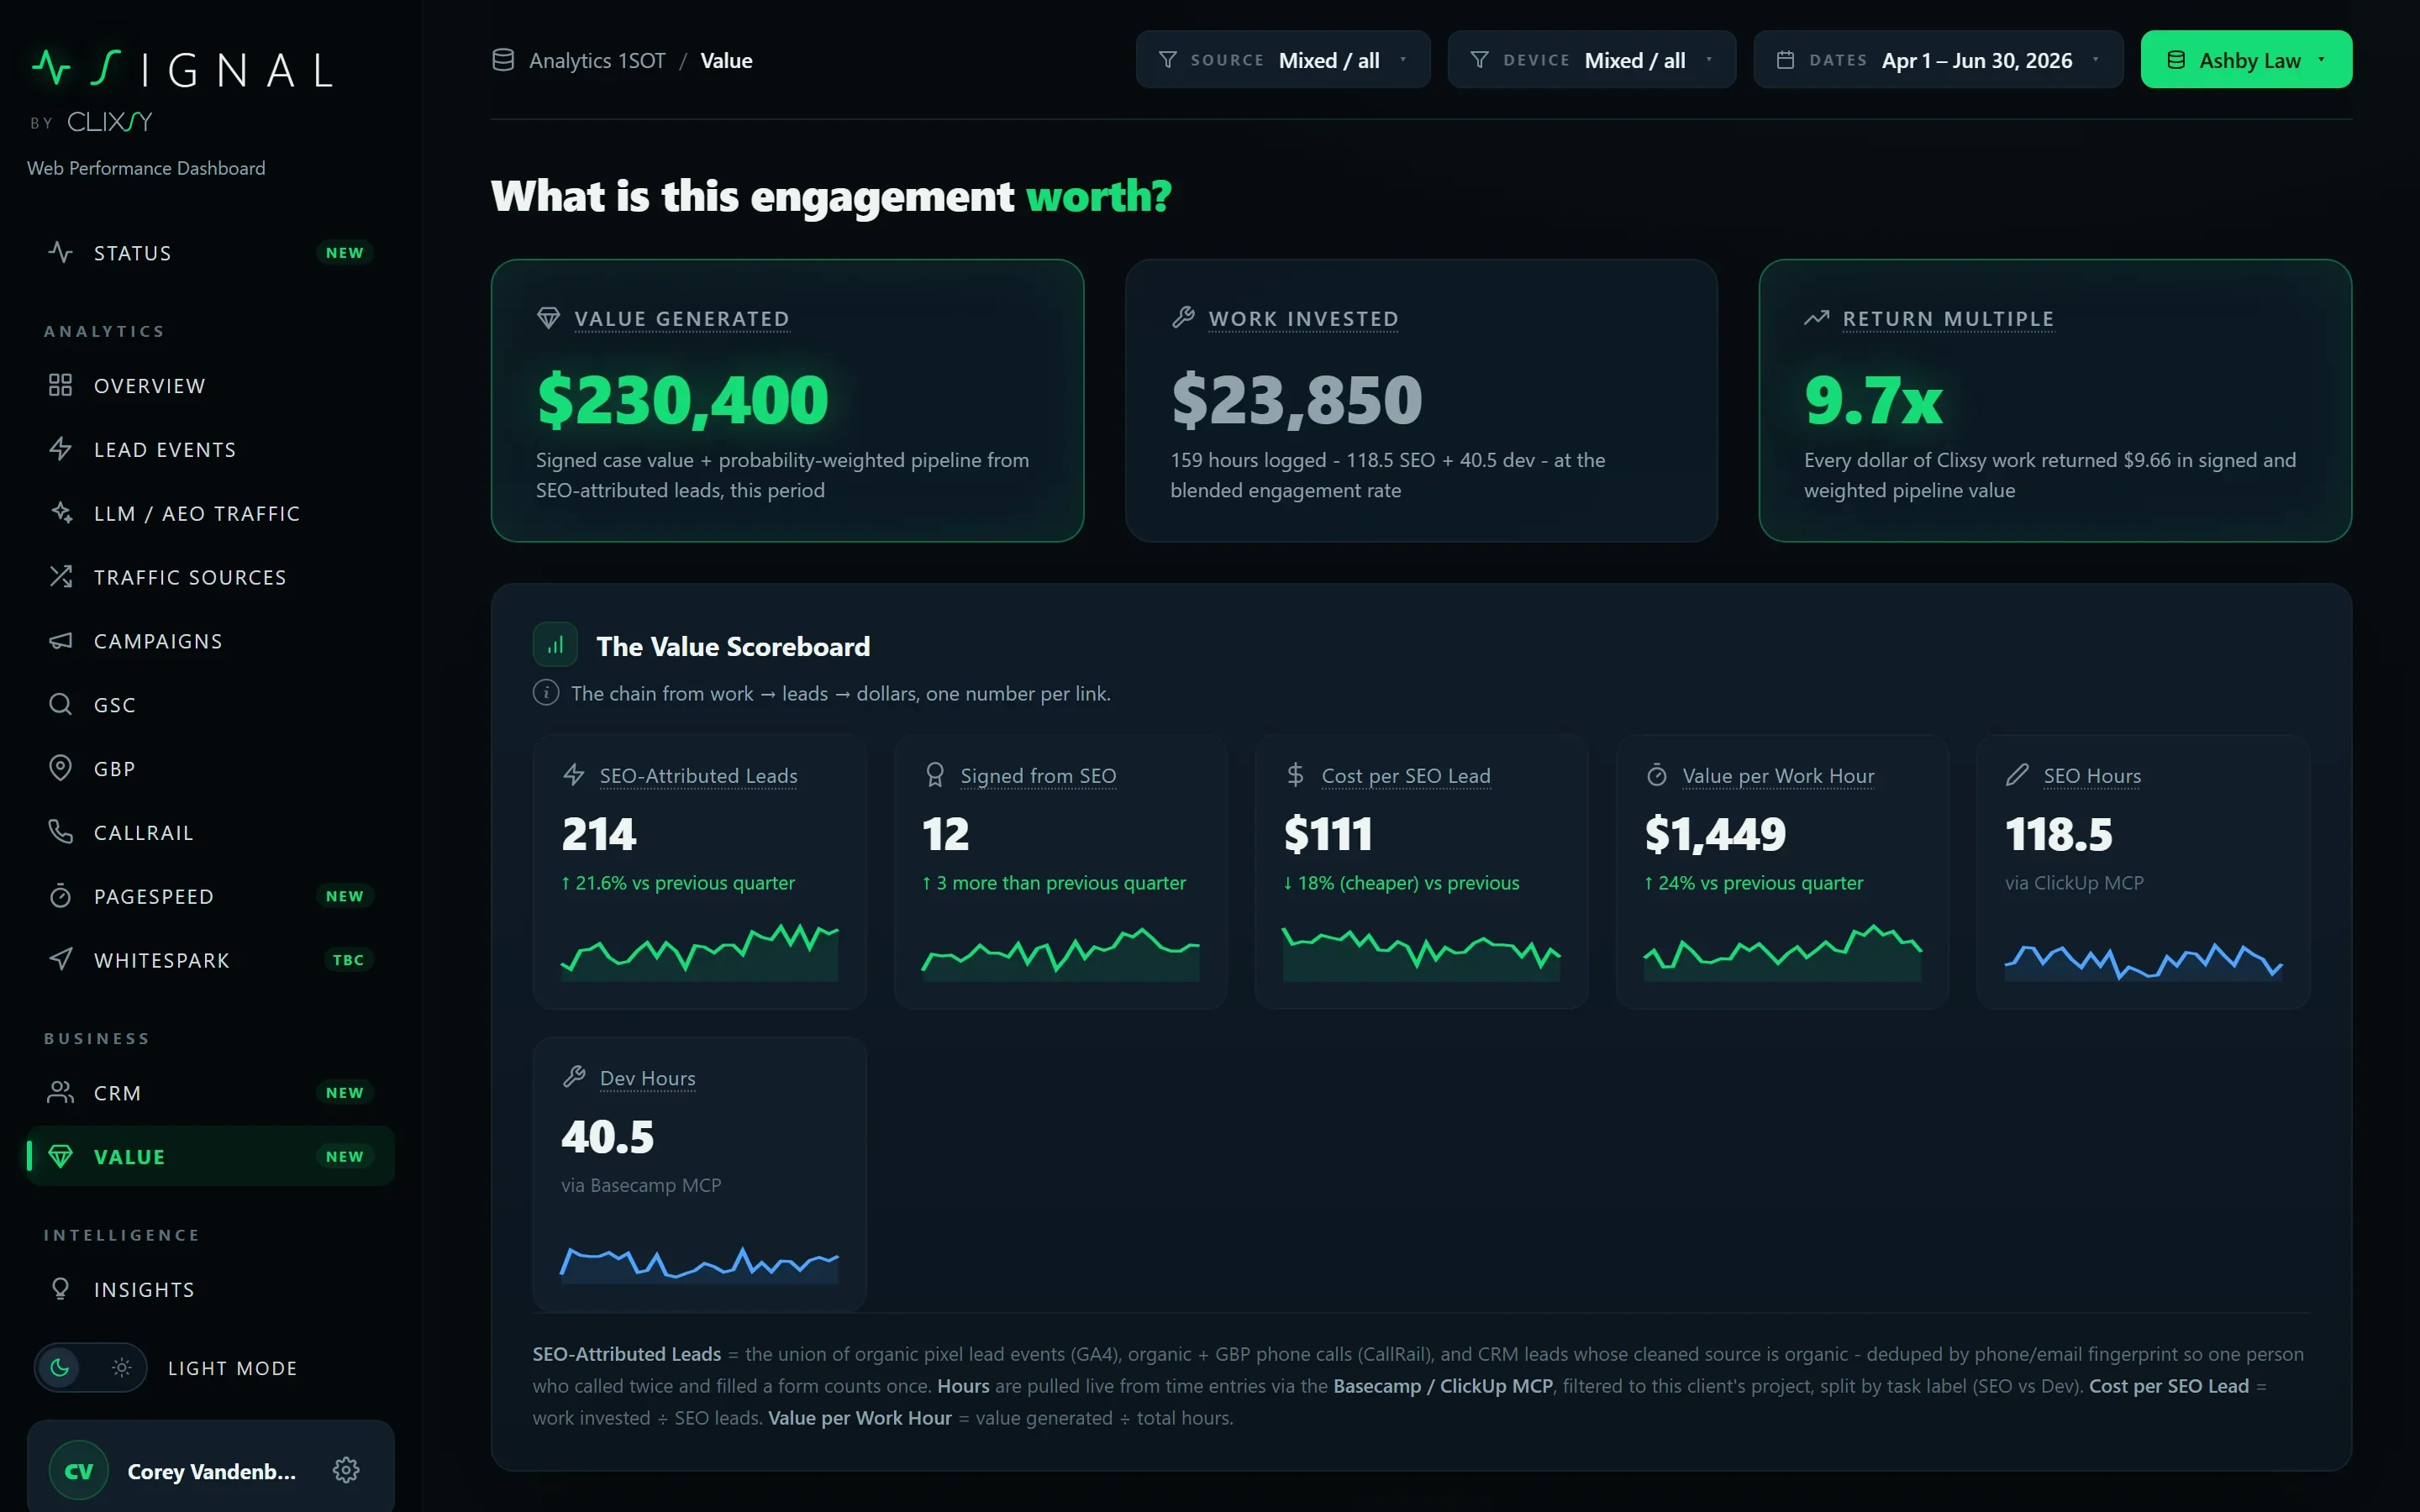
The page clients open first. Value generated against fees invested, the return multiple, and the maths shown in full so nobody has to take our word for it.

  • 01From lead to dollar. SEO-attributed leads to qualified to signed, valued from signed fees plus stage-weighted pipeline built on the firm's own history.
  • 02Hours, streamed. SEO and dev time arrives from ClickUp and Basecamp over MCP. Nobody pastes a timesheet.
  • 03Two methods must agree. Return is cross-checked against organic media value and published only when both land within 15%.
Signal | Value
Signal value page: value generated, fees invested and the return multiple in a hero card, above a scoreboard of SEO-attributed leads, signed cases, cost per SEO lead and hours streamed from project tools
Analytics

Everything at a glance.

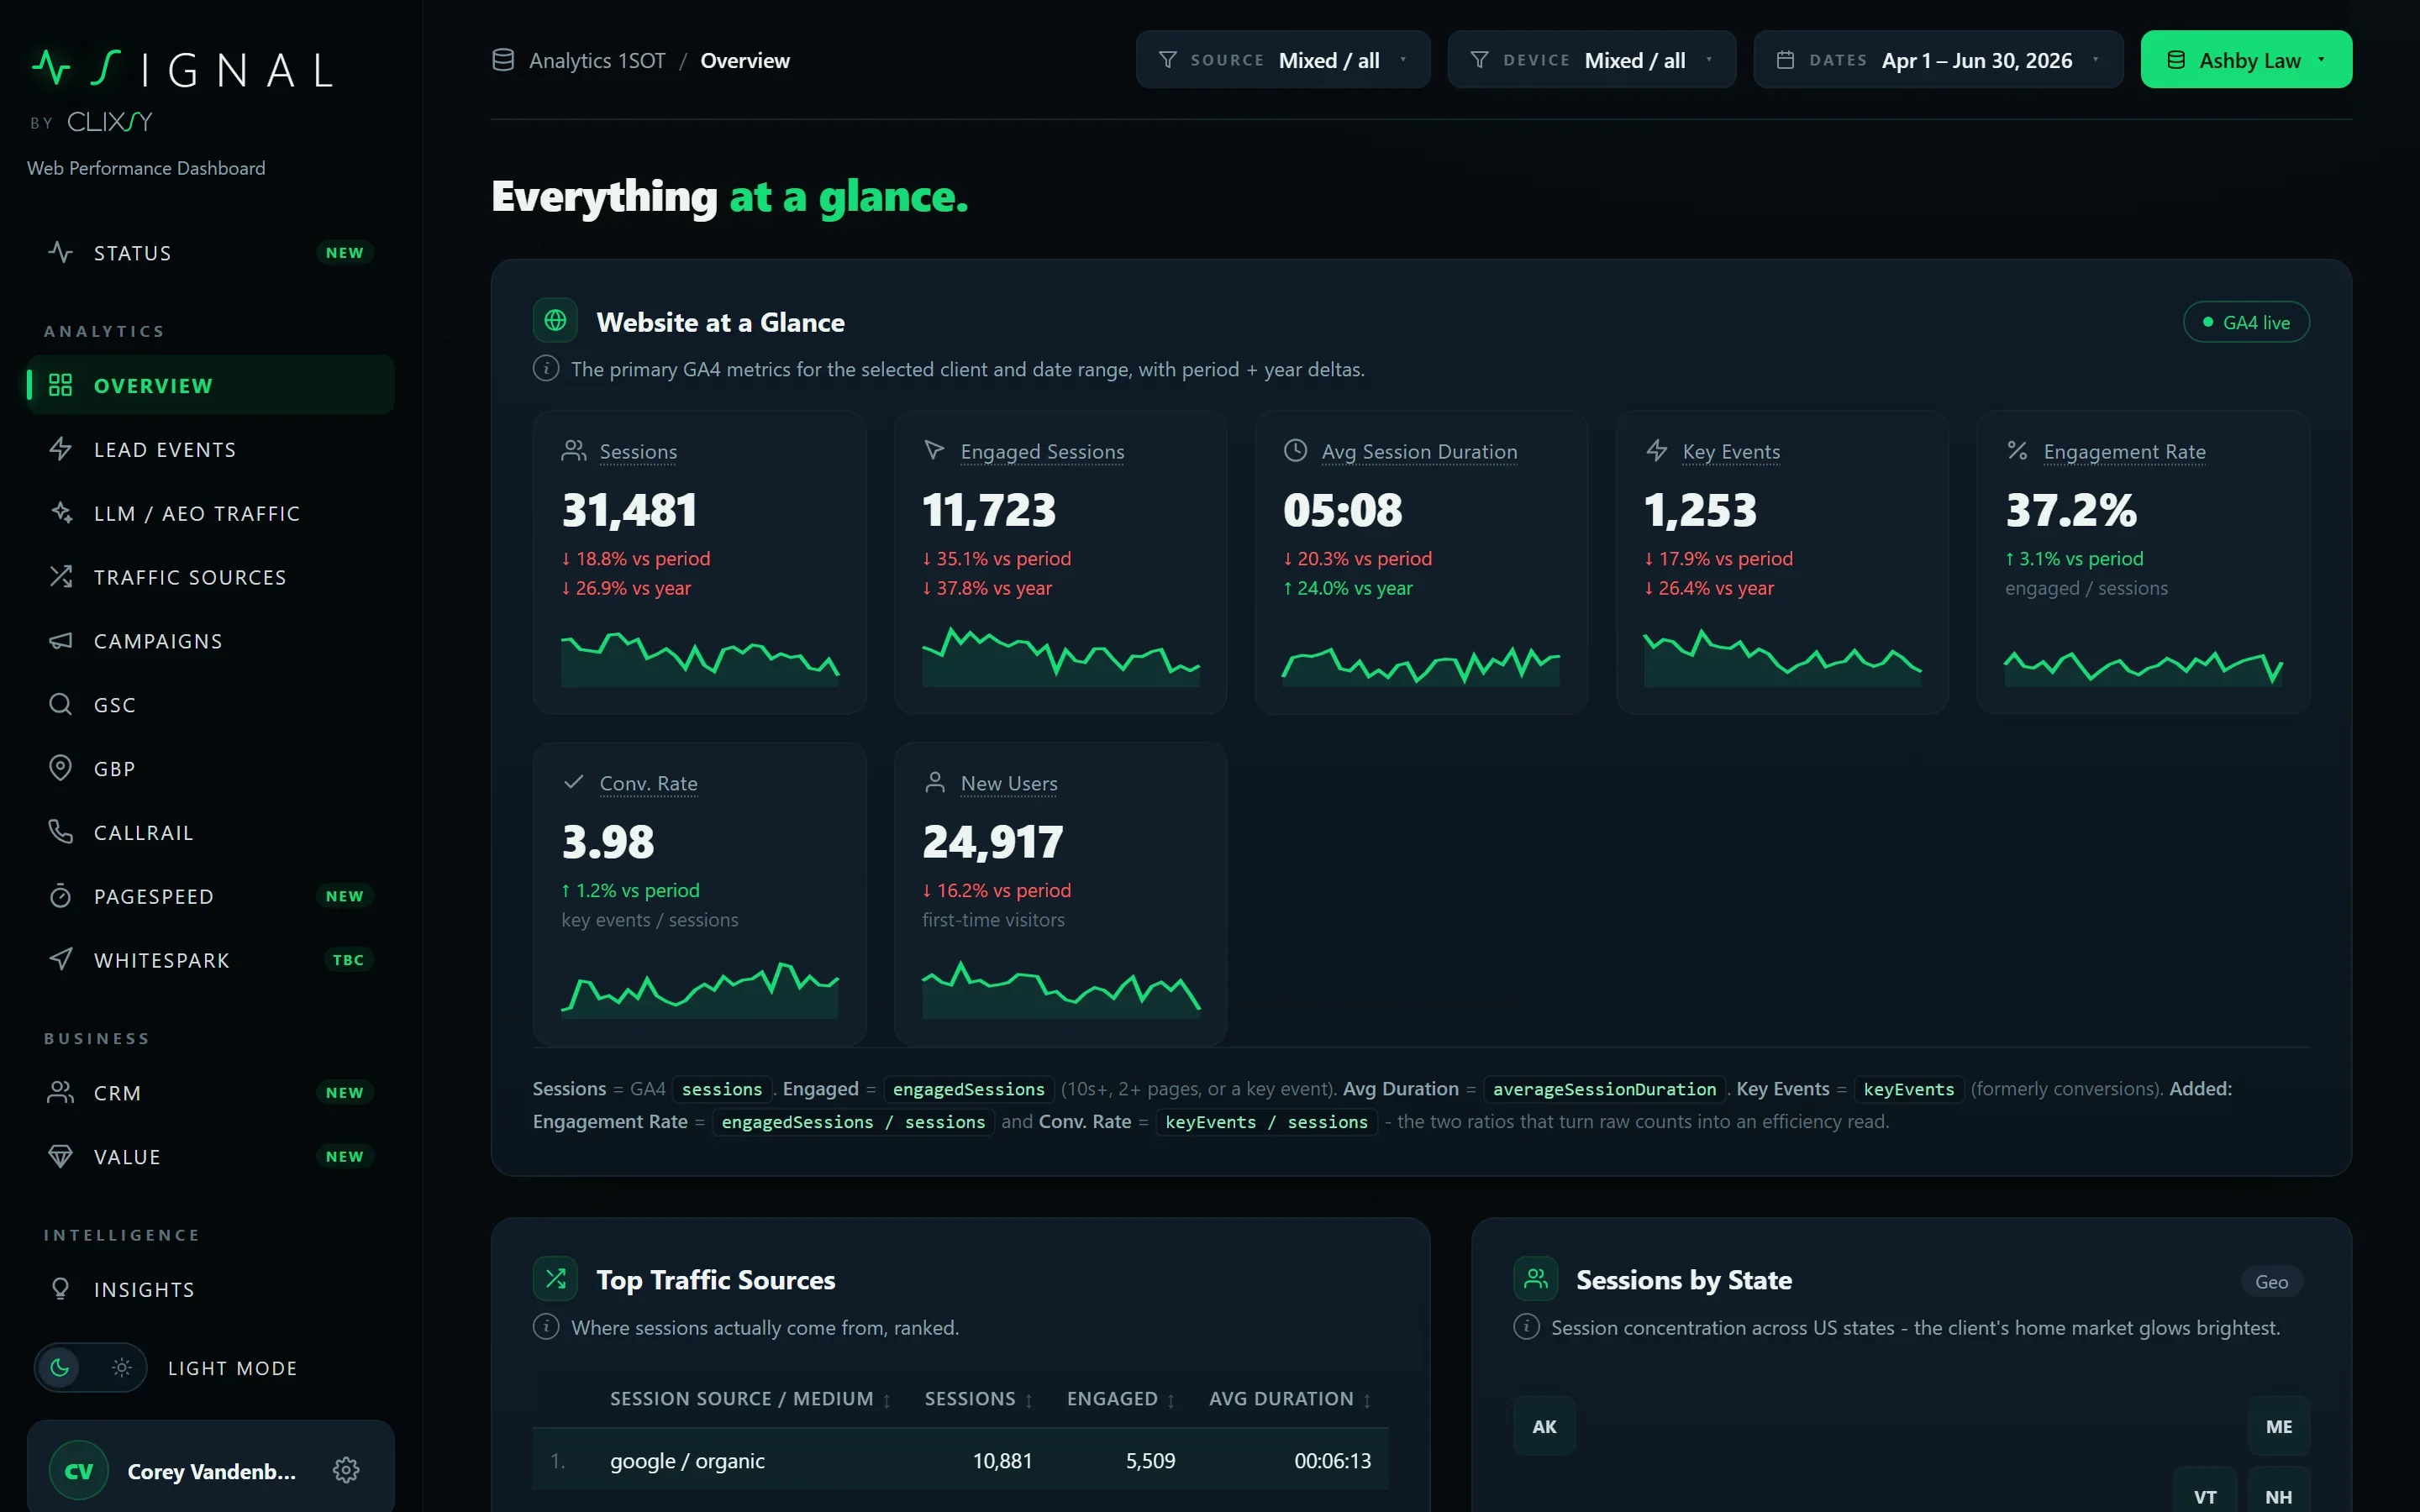
GA4 the way a client reads it. Sessions, engaged sessions, key events, sources, cities and landing pages, with a conversion rate on every row and period-over-period and year-over-year deltas on every number.

  • 01Sessions by state. A tile map, not a table, so the geography reads in a second.
  • 02Landing pages that convert. Key events over sessions, per page, sorted by what actually produced a lead.
  • 03Bot traffic called out. A data-centre city spiking sessions gets a note, not a celebration.
Signal | Overview
Signal overview page: seven GA4 score cards with period and year deltas, a top traffic sources table and a sessions-by-state tile map
Local

The local pack, mapped.

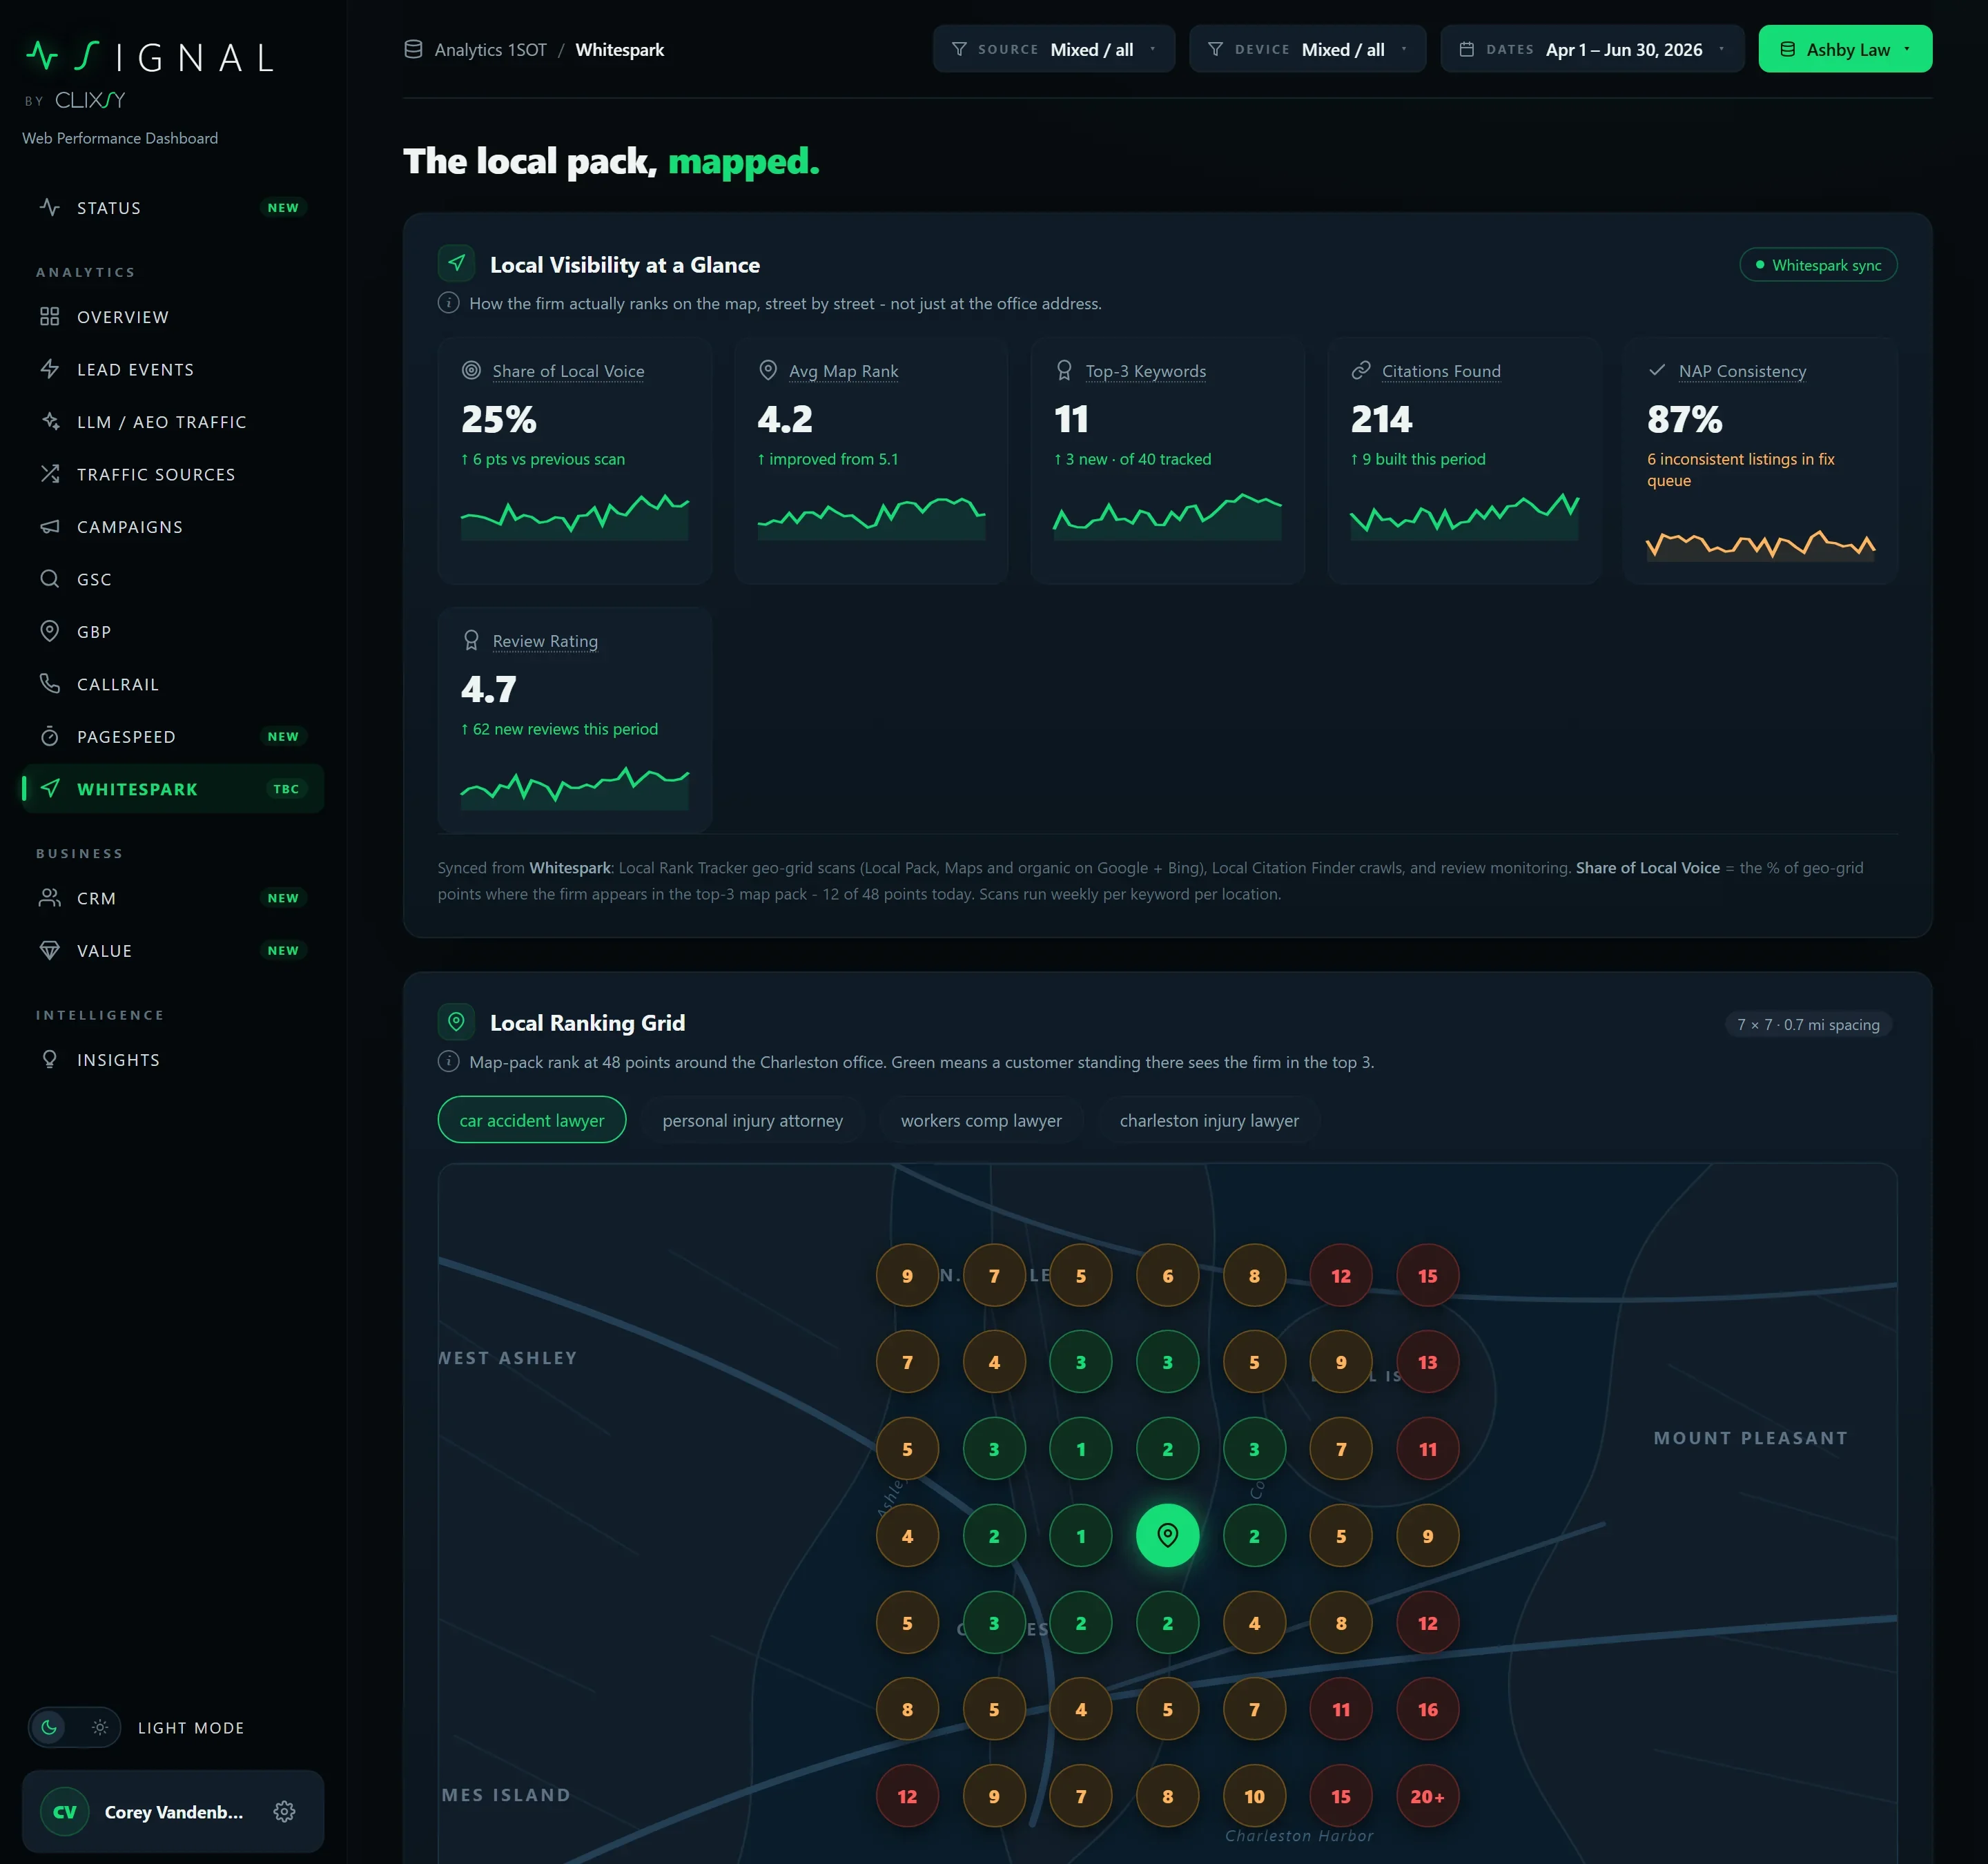
A seven-by-seven grid across the market, synced from Whitespark. Share of local voice is the share of grid points in the top three, so the number and the map can never disagree.

  • 01Tracked keywords. Map rank, organic rank, share of voice and change, per term.
  • 02Competitors. Their share of voice beside yours, with review velocity as the explanation.
  • 03Citations, NAP and reviews. Live, opportunity or inconsistent, directory by directory.
Signal | Whitespark
Signal local pack page: share of local voice, average map rank and citation scores above a seven-by-seven local ranking grid drawn over a city basemap
Calls

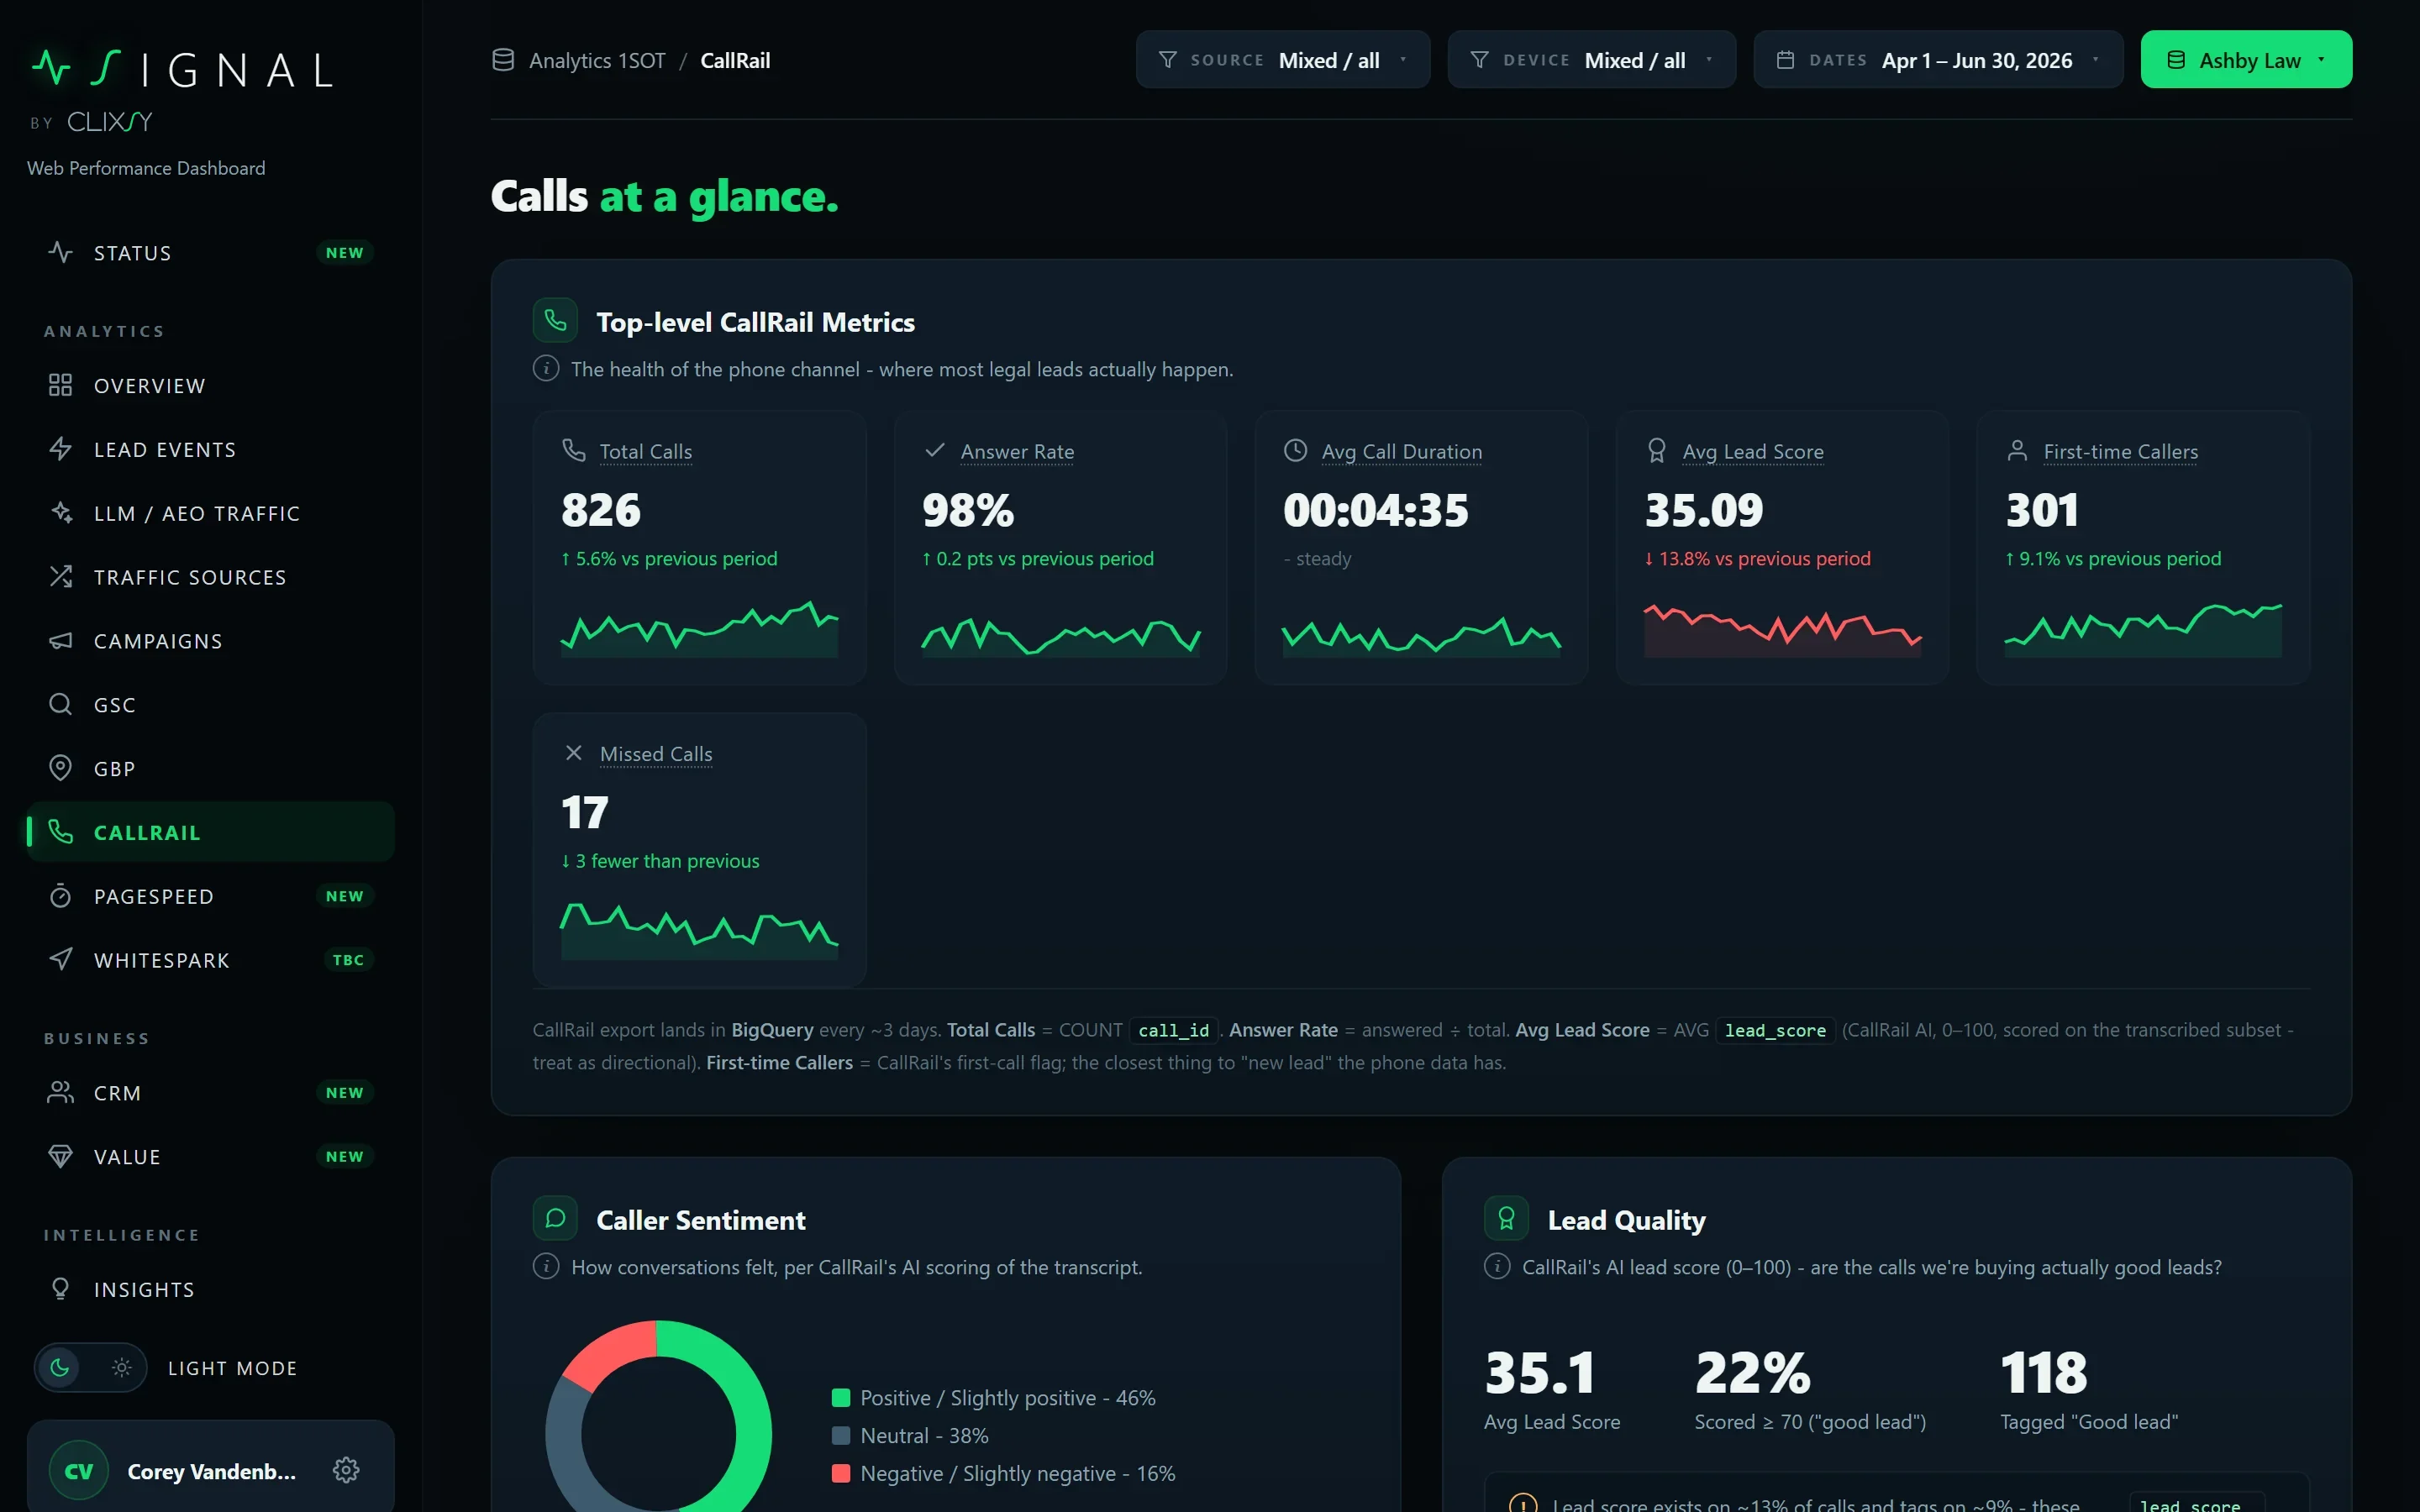
Calls at a glance.

Every tracked call scored, summarised and searchable. Answer rate, lead score, sentiment, when calls come in, and the words callers actually use.

  • 01Recent calls with summaries. Outcome, duration, sentiment, score, tags and a play link, one row per call.
  • 02When calls come in. A weekday-by-hour heatmap that settles the "should we answer on Saturdays" debate.
  • 03Lead quality, honestly. Scored subsets are labelled as subsets. Small numbers carry their caveat.
Signal | CallRail
Signal CallRail page: call volume, answer rate, average duration and lead score cards, a caller sentiment donut and a lead quality panel
AEO

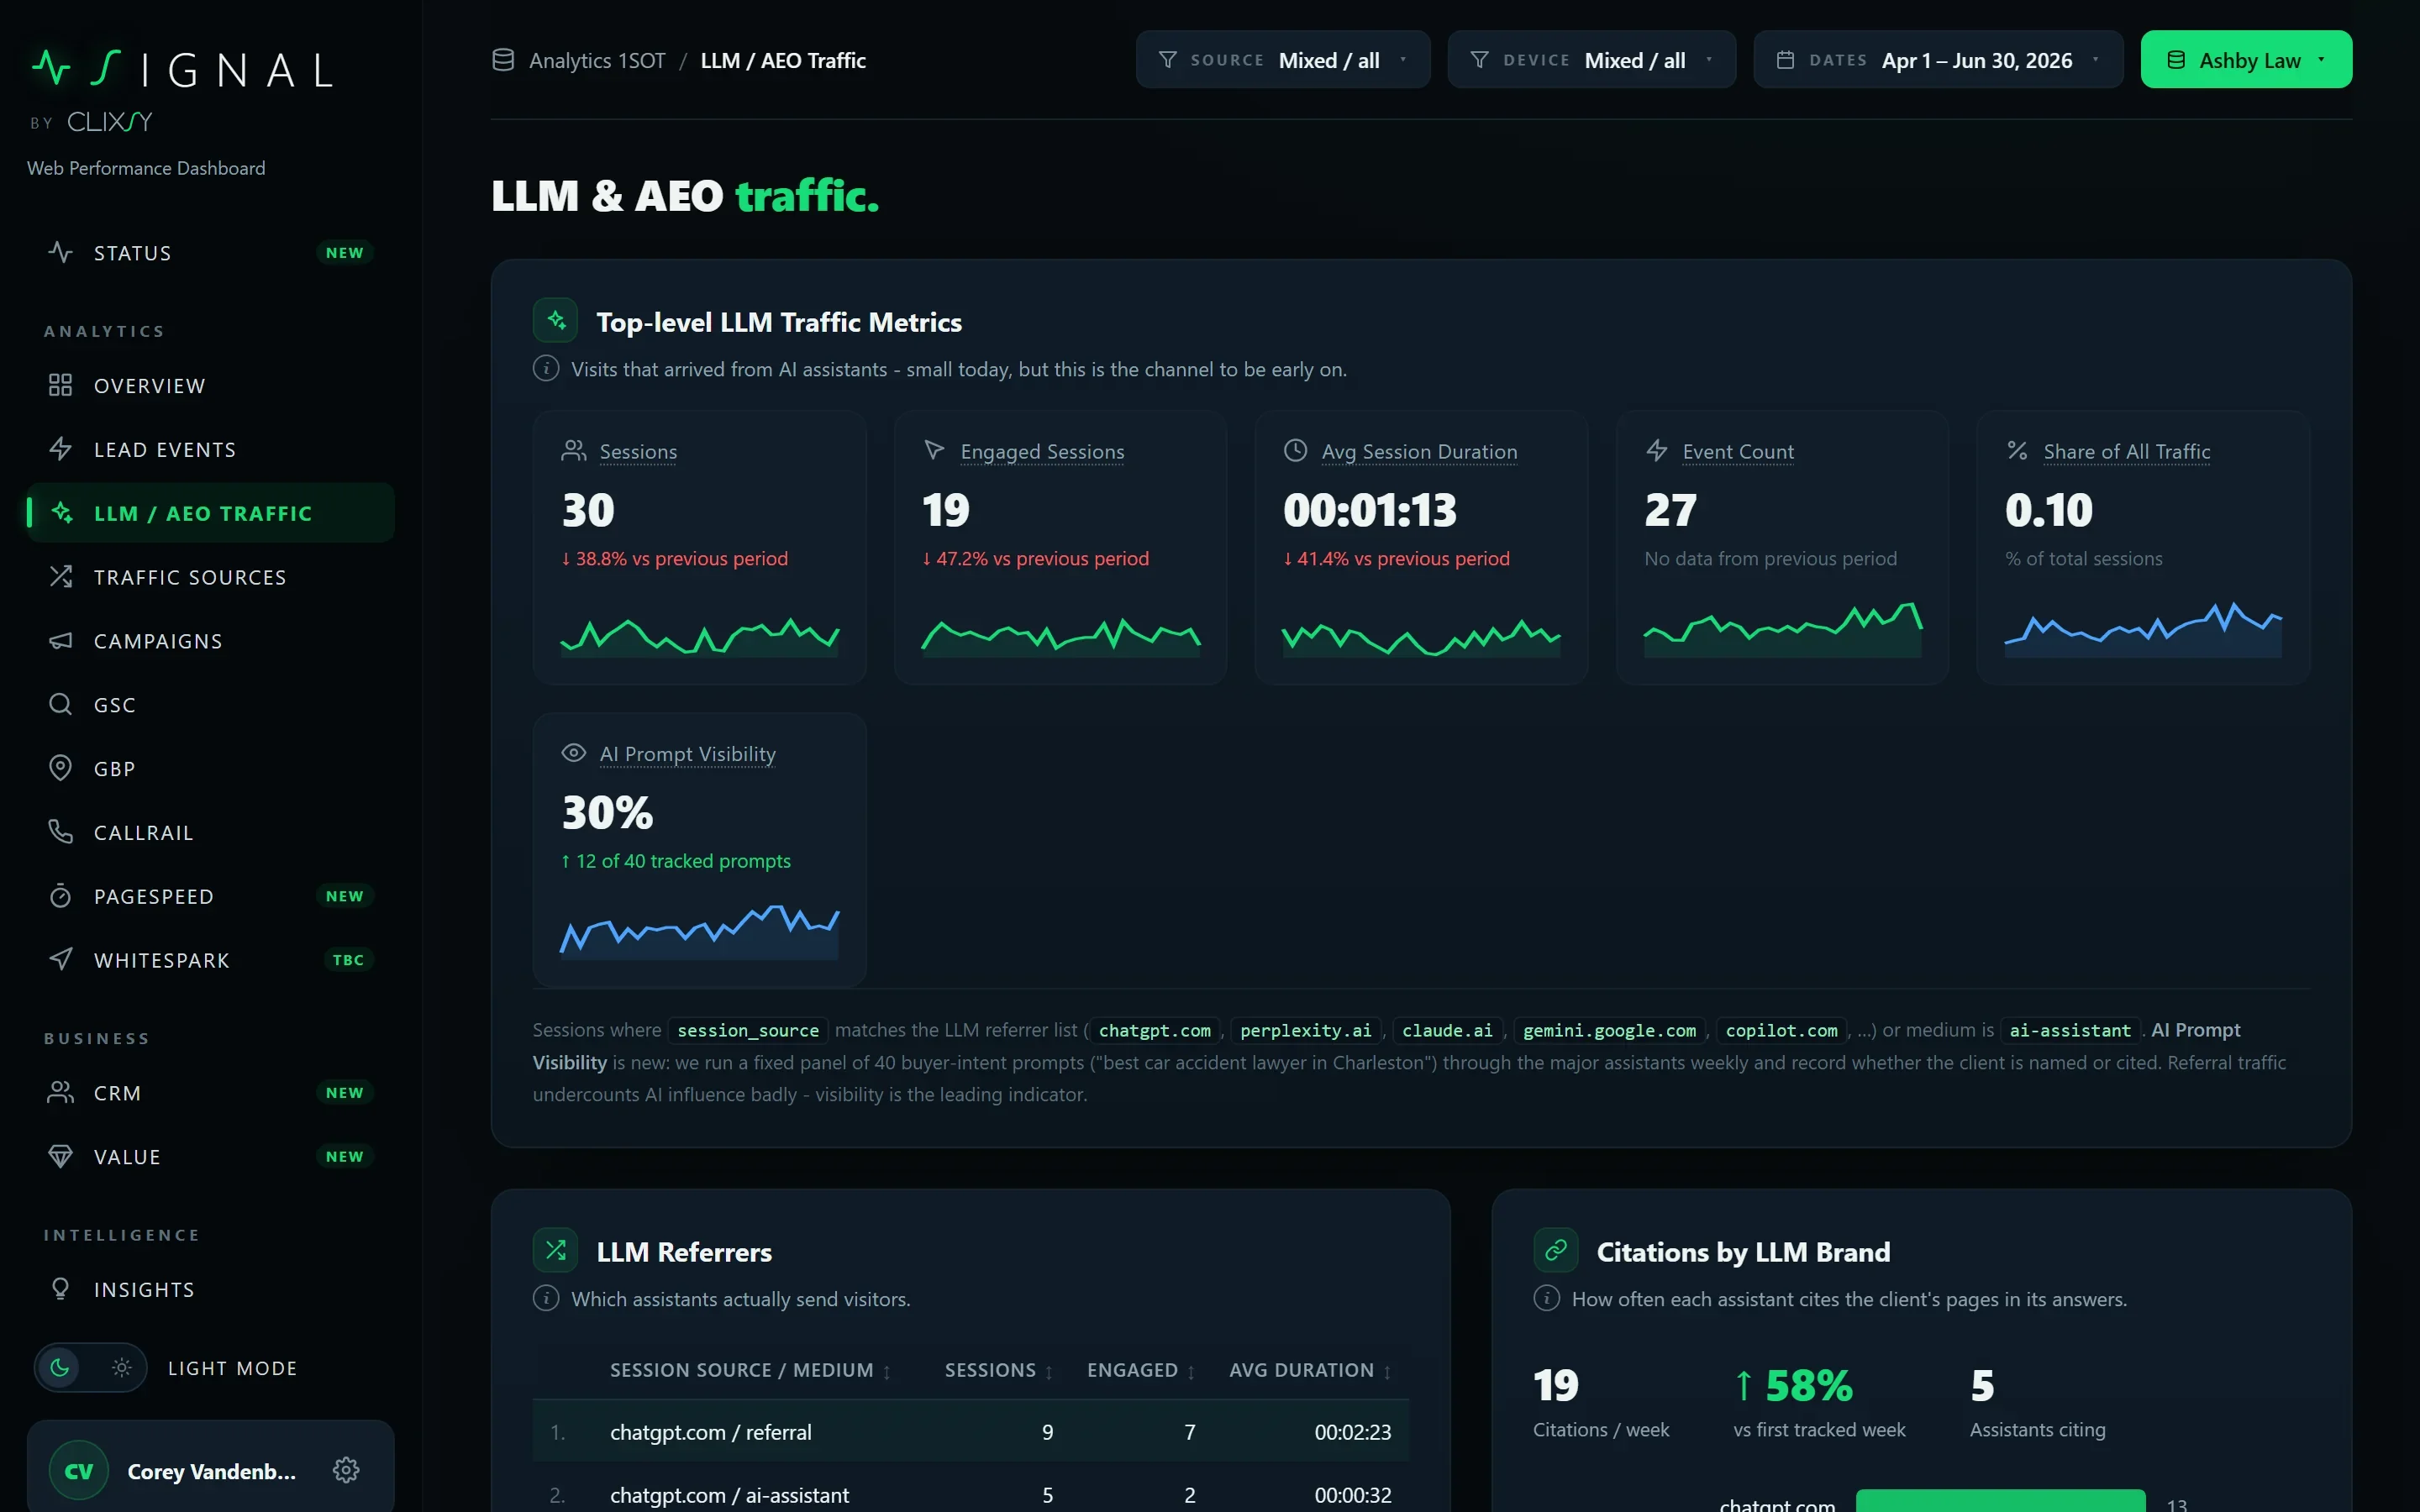
Traffic from the assistants.

Sessions from ChatGPT, Perplexity, Gemini, Claude and Copilot, tracked like any other channel. Plus a weekly 40-prompt panel: which assistants cite the firm, and for which pages.

  • 01Citations by LLM brand. Who cites you, how often, trending week over week.
  • 02Prompt visibility. The share of a fixed prompt panel where the firm appears at all.
  • 03Pages LLMs send people to. The content that earns the referral, so the content team writes more of it.
Signal | LLM and AEO
Signal LLM and AEO traffic page: sessions from AI assistants, prompt visibility, an LLM referrers table and citations by LLM brand
Also on the screen

Eight more views.
Same login.

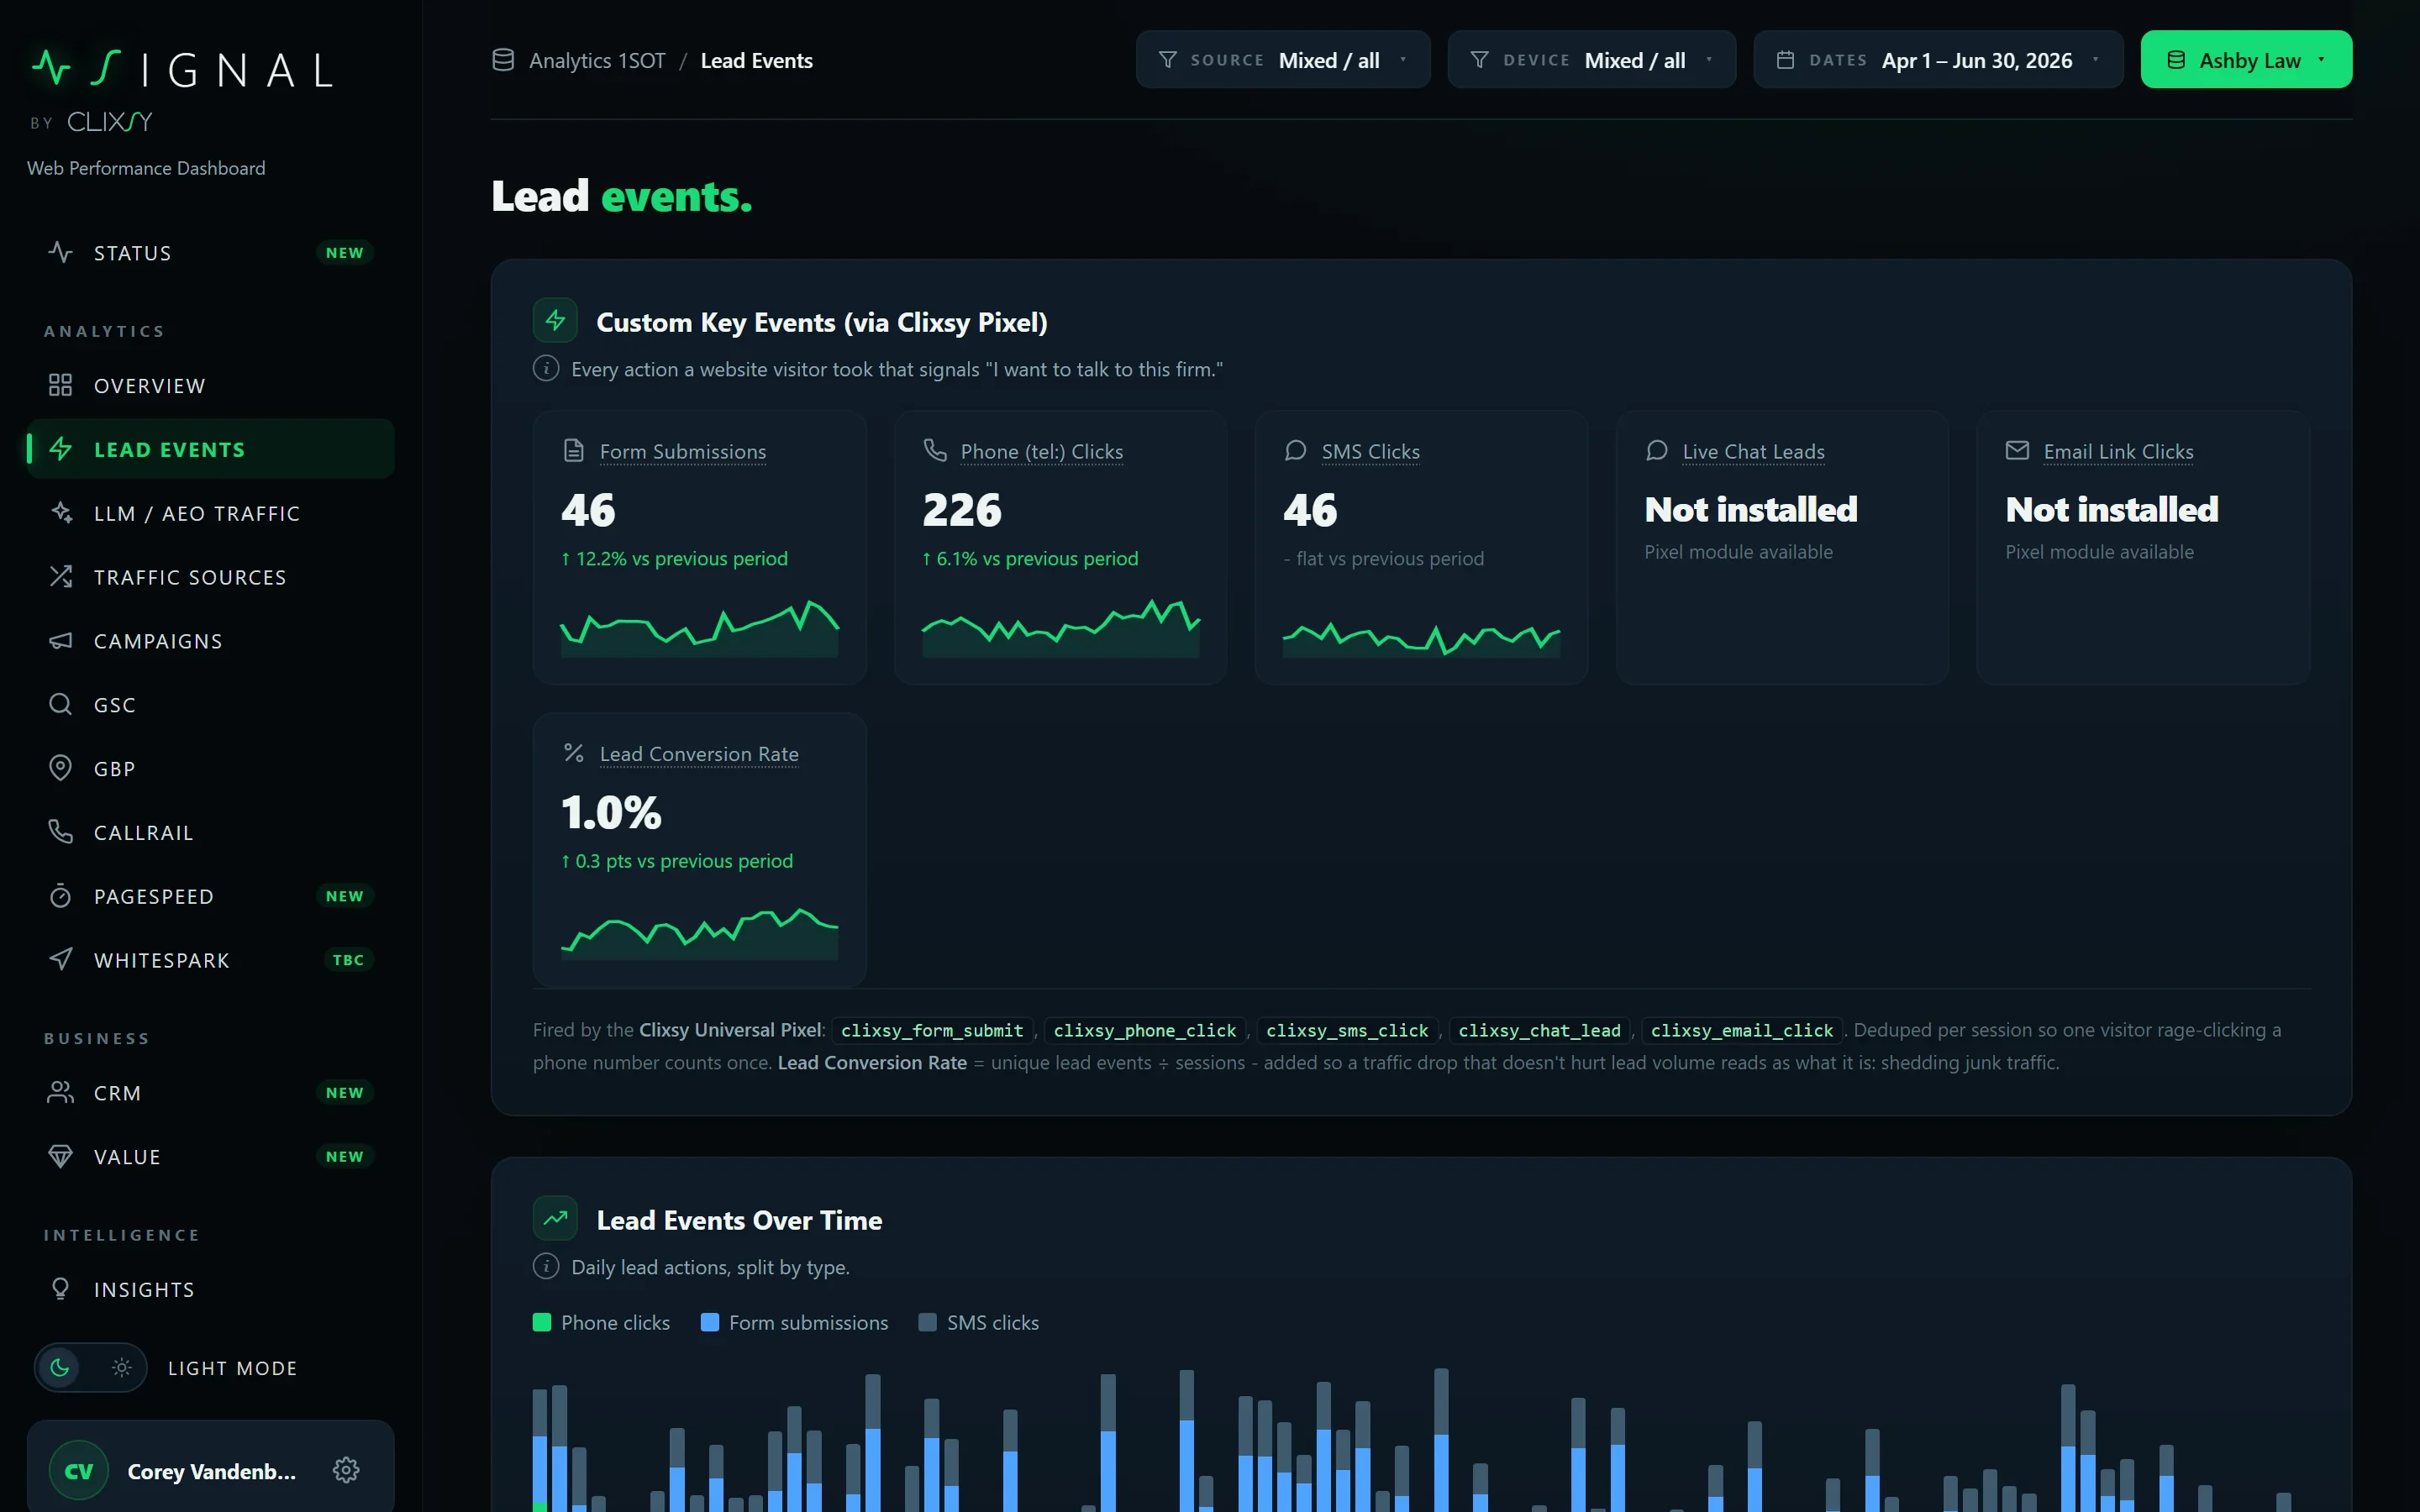
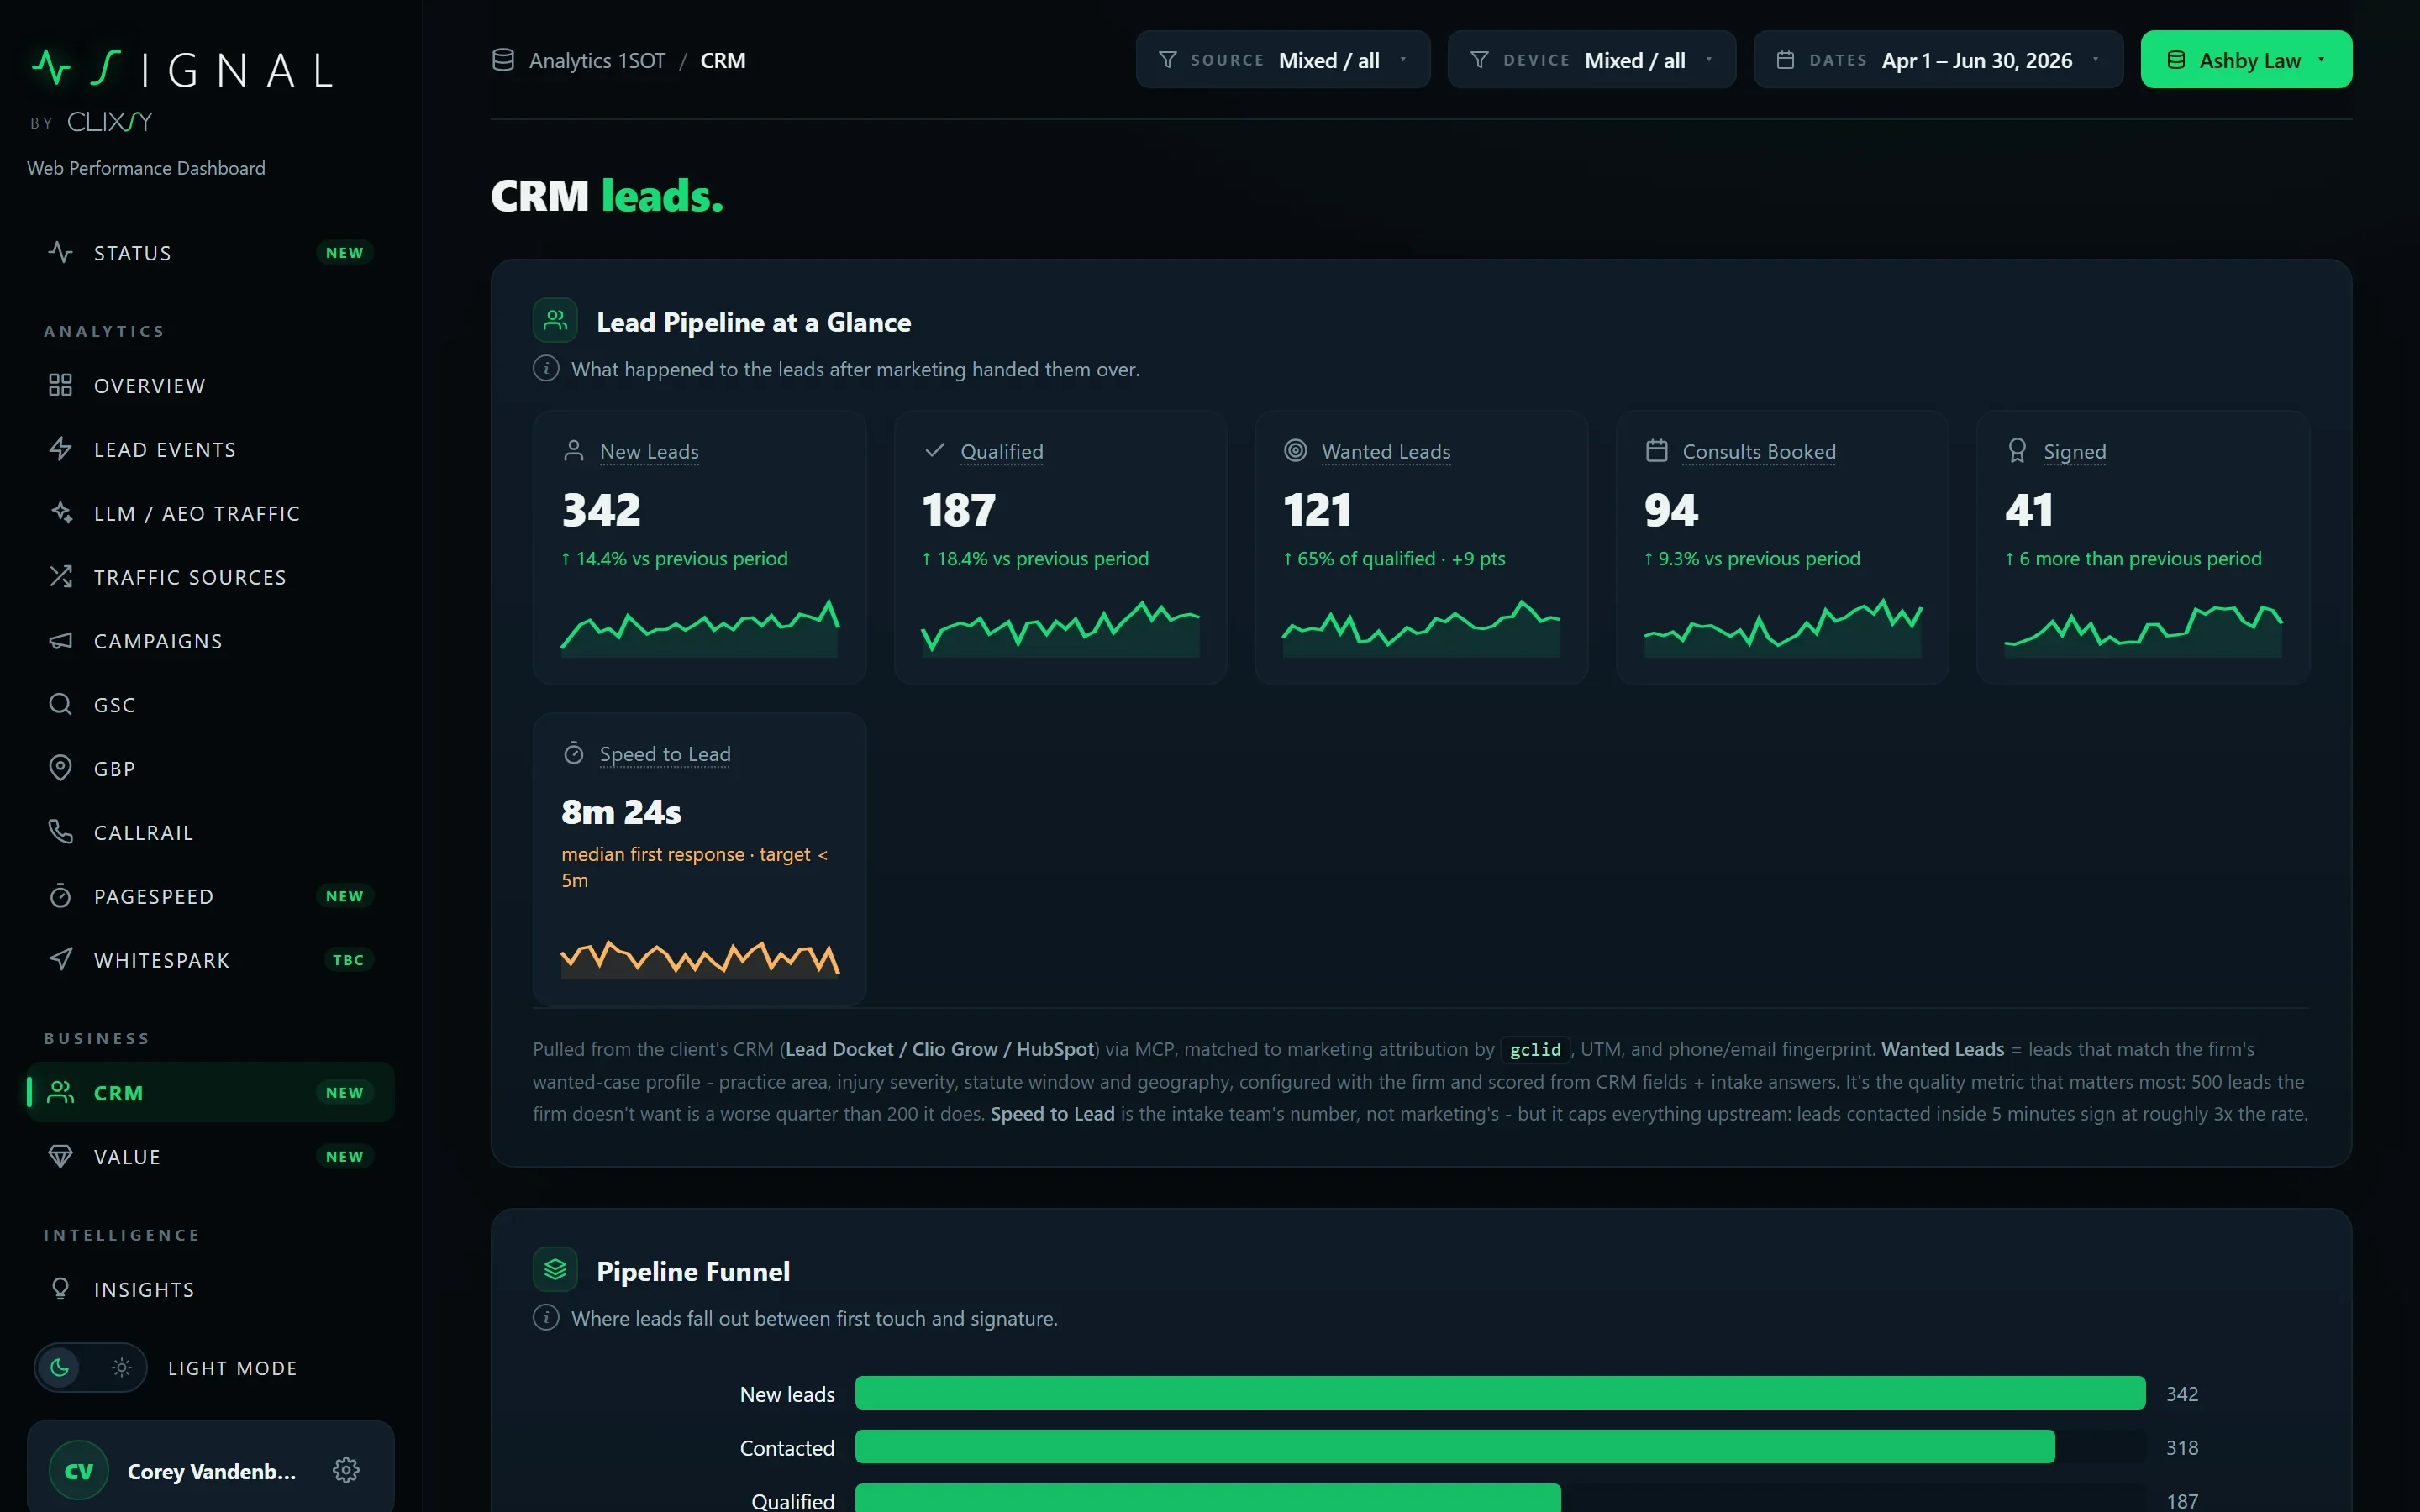
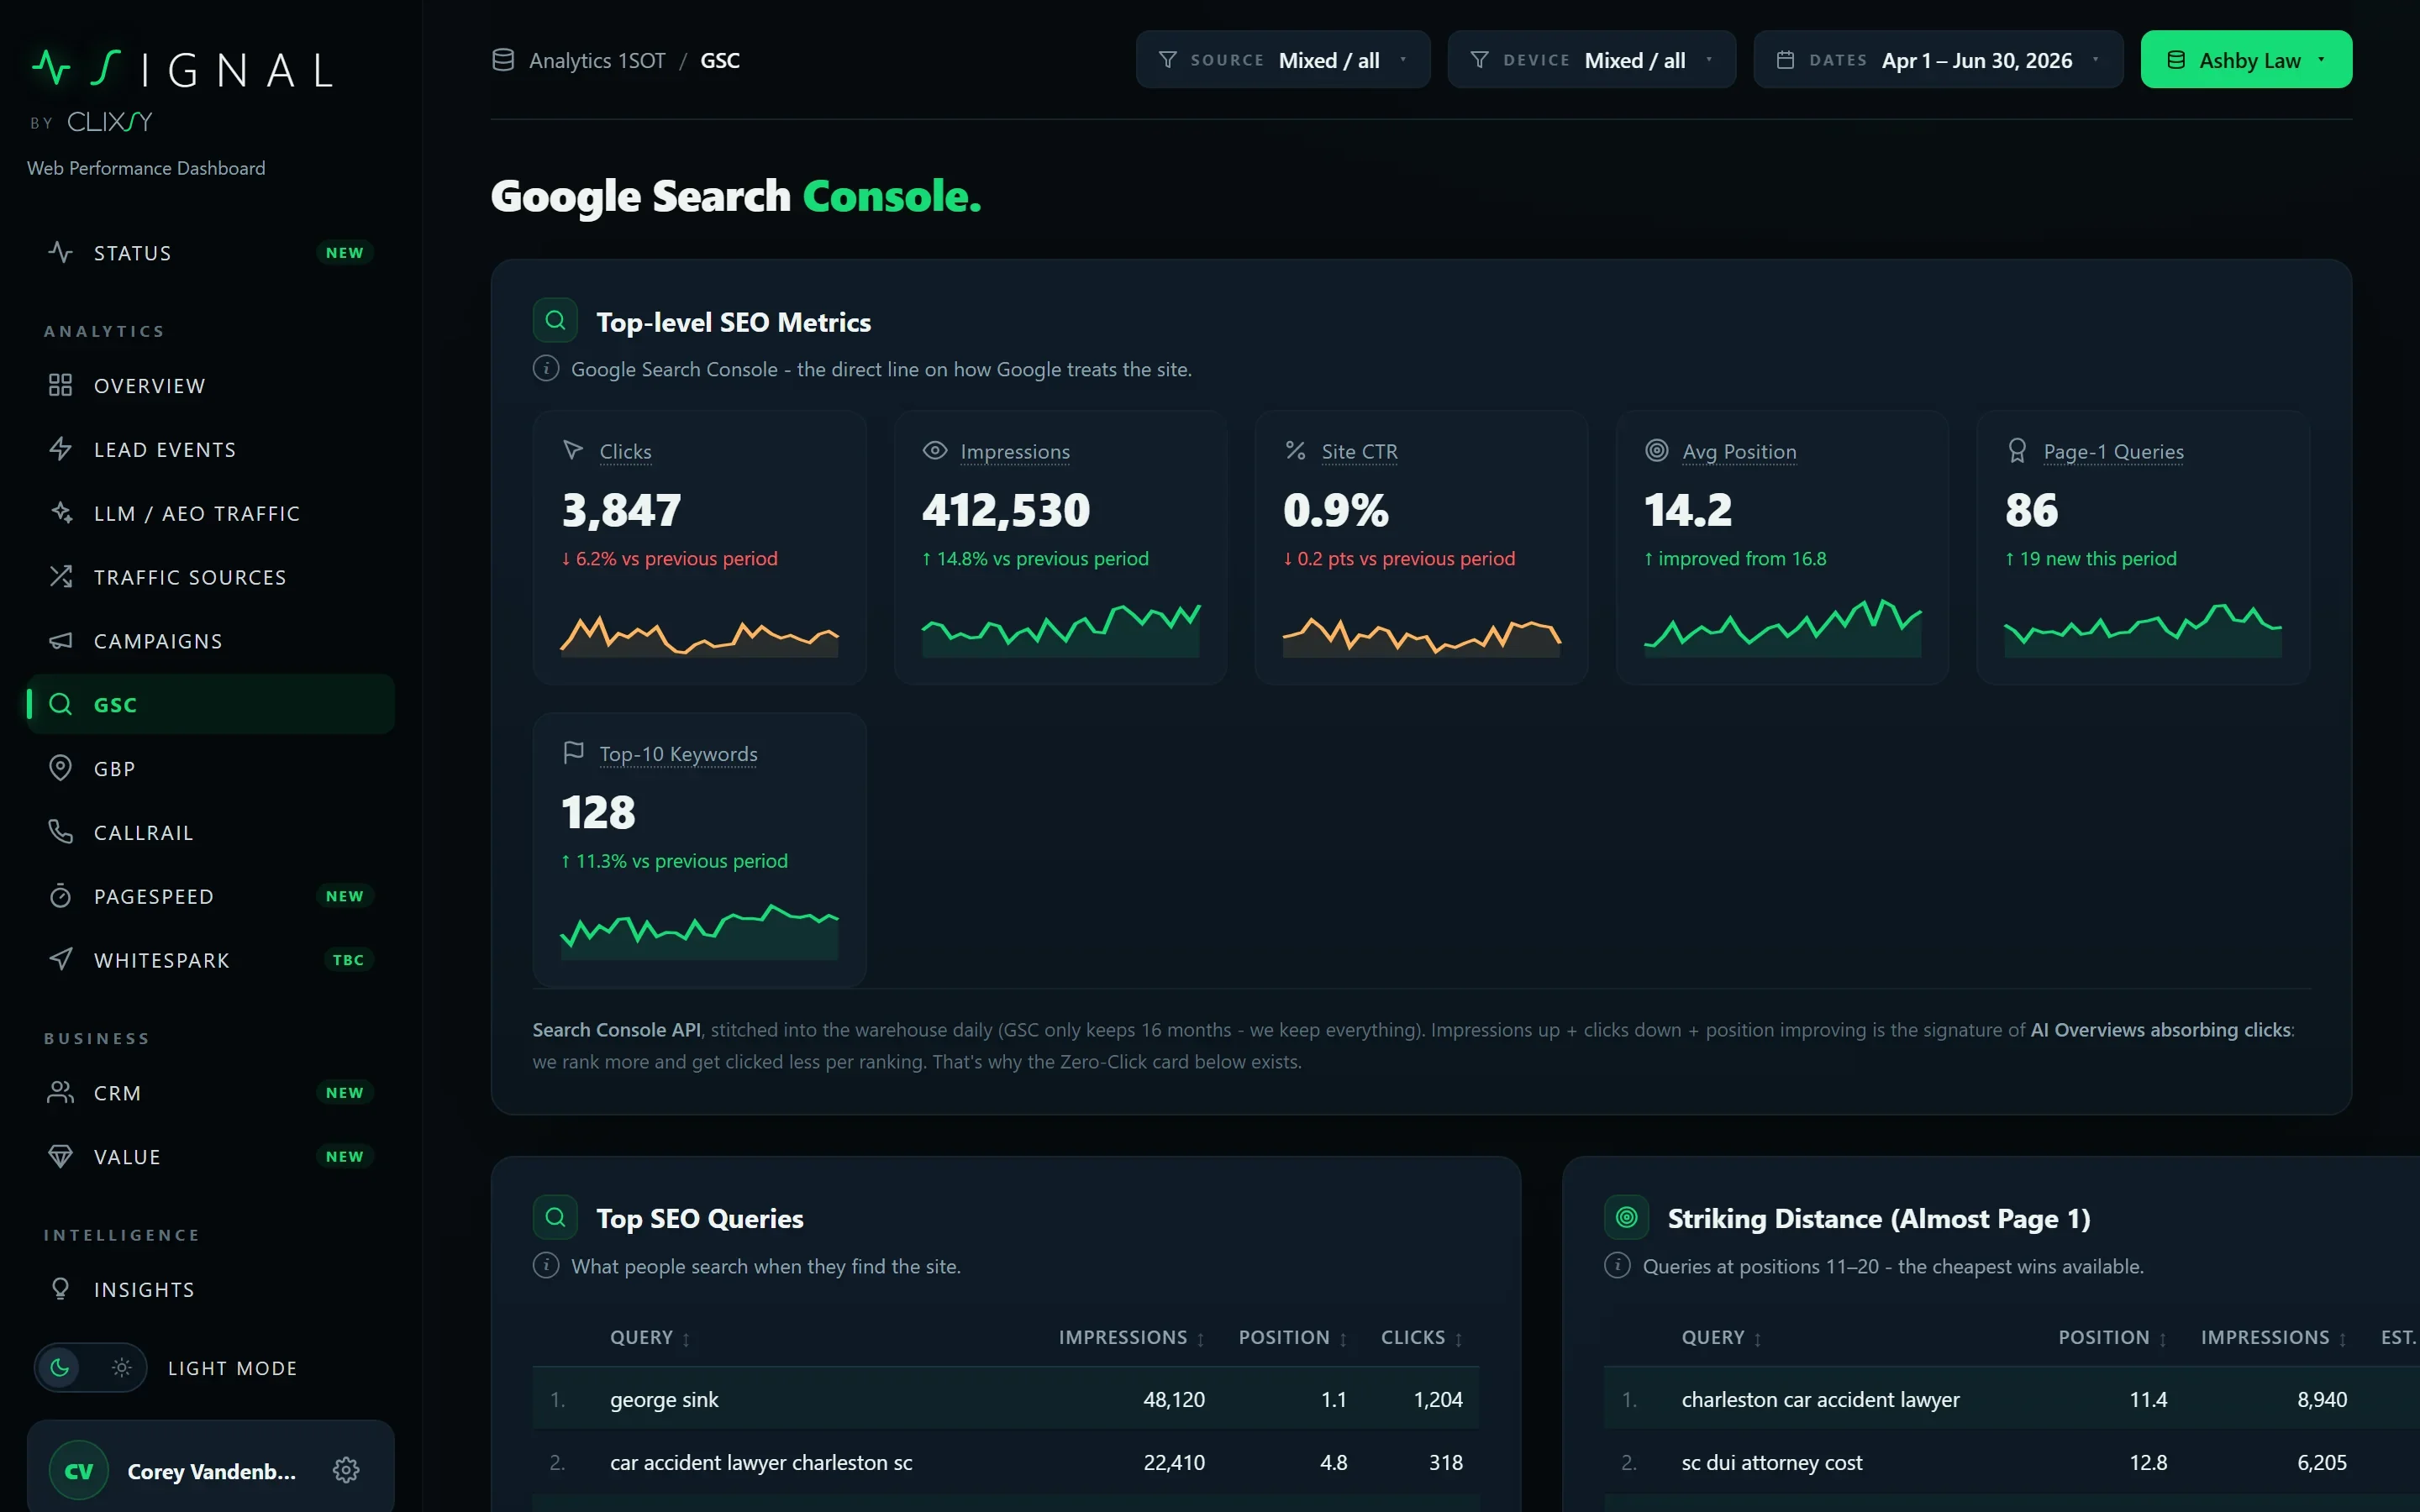
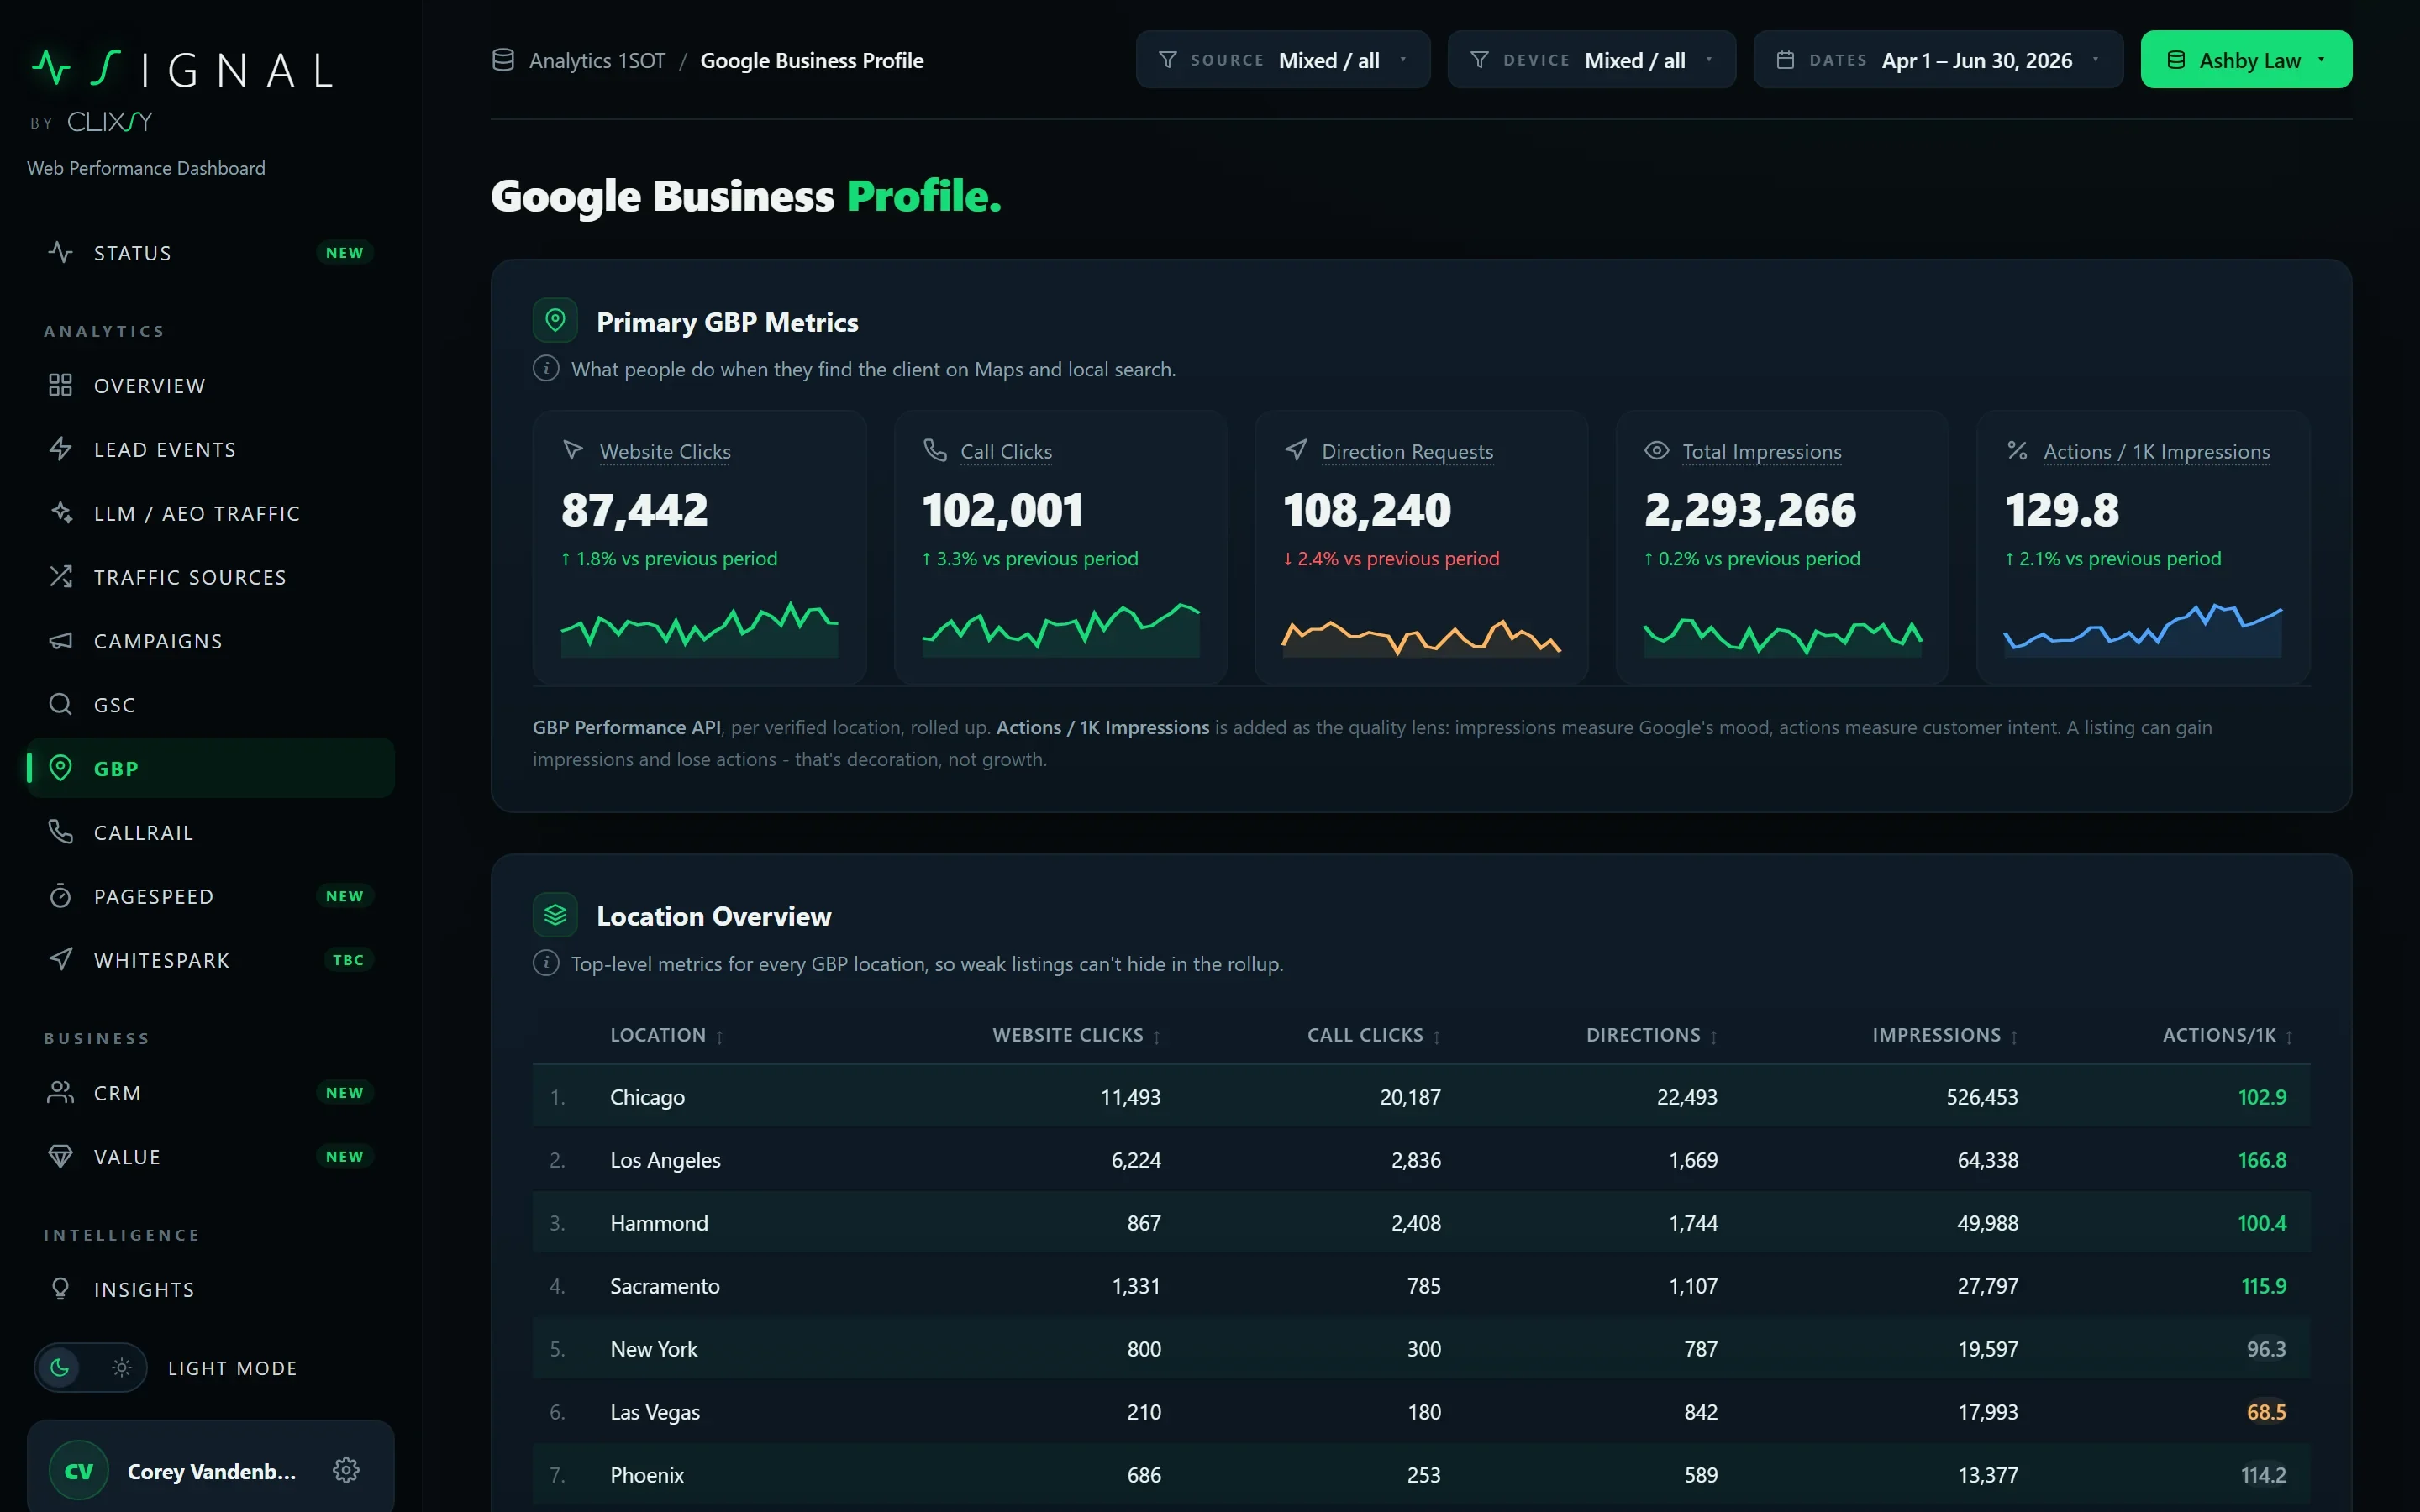
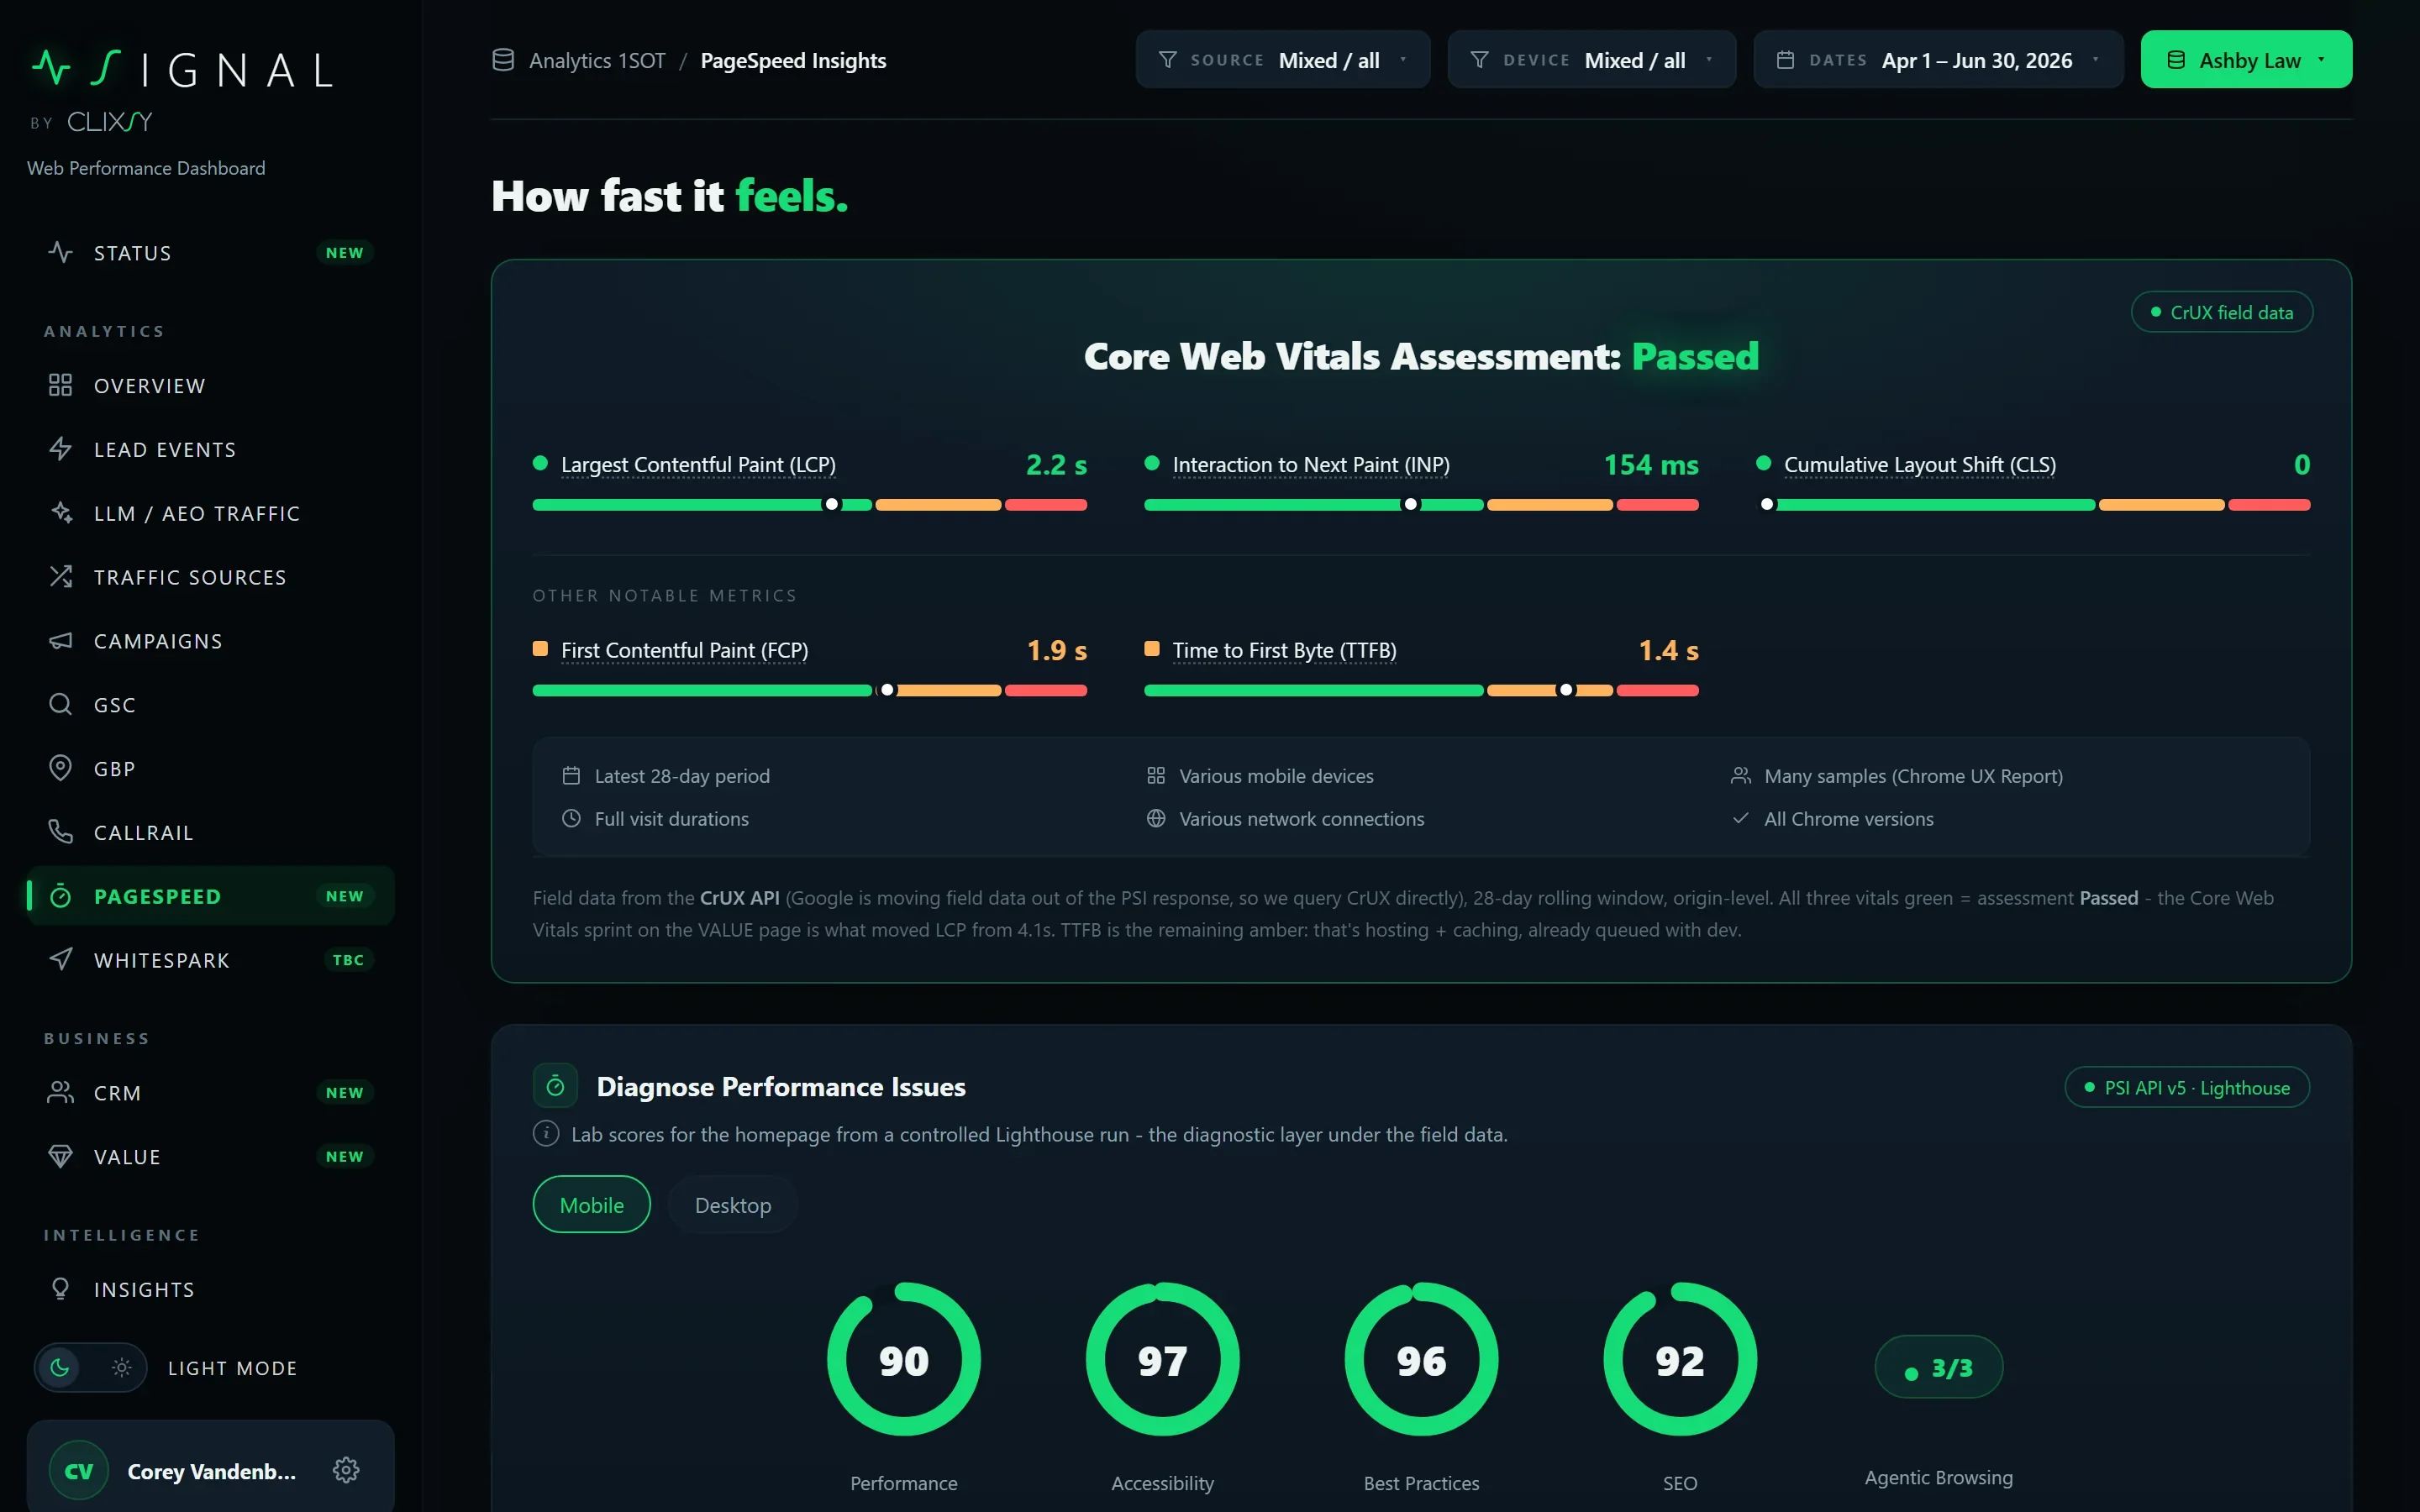
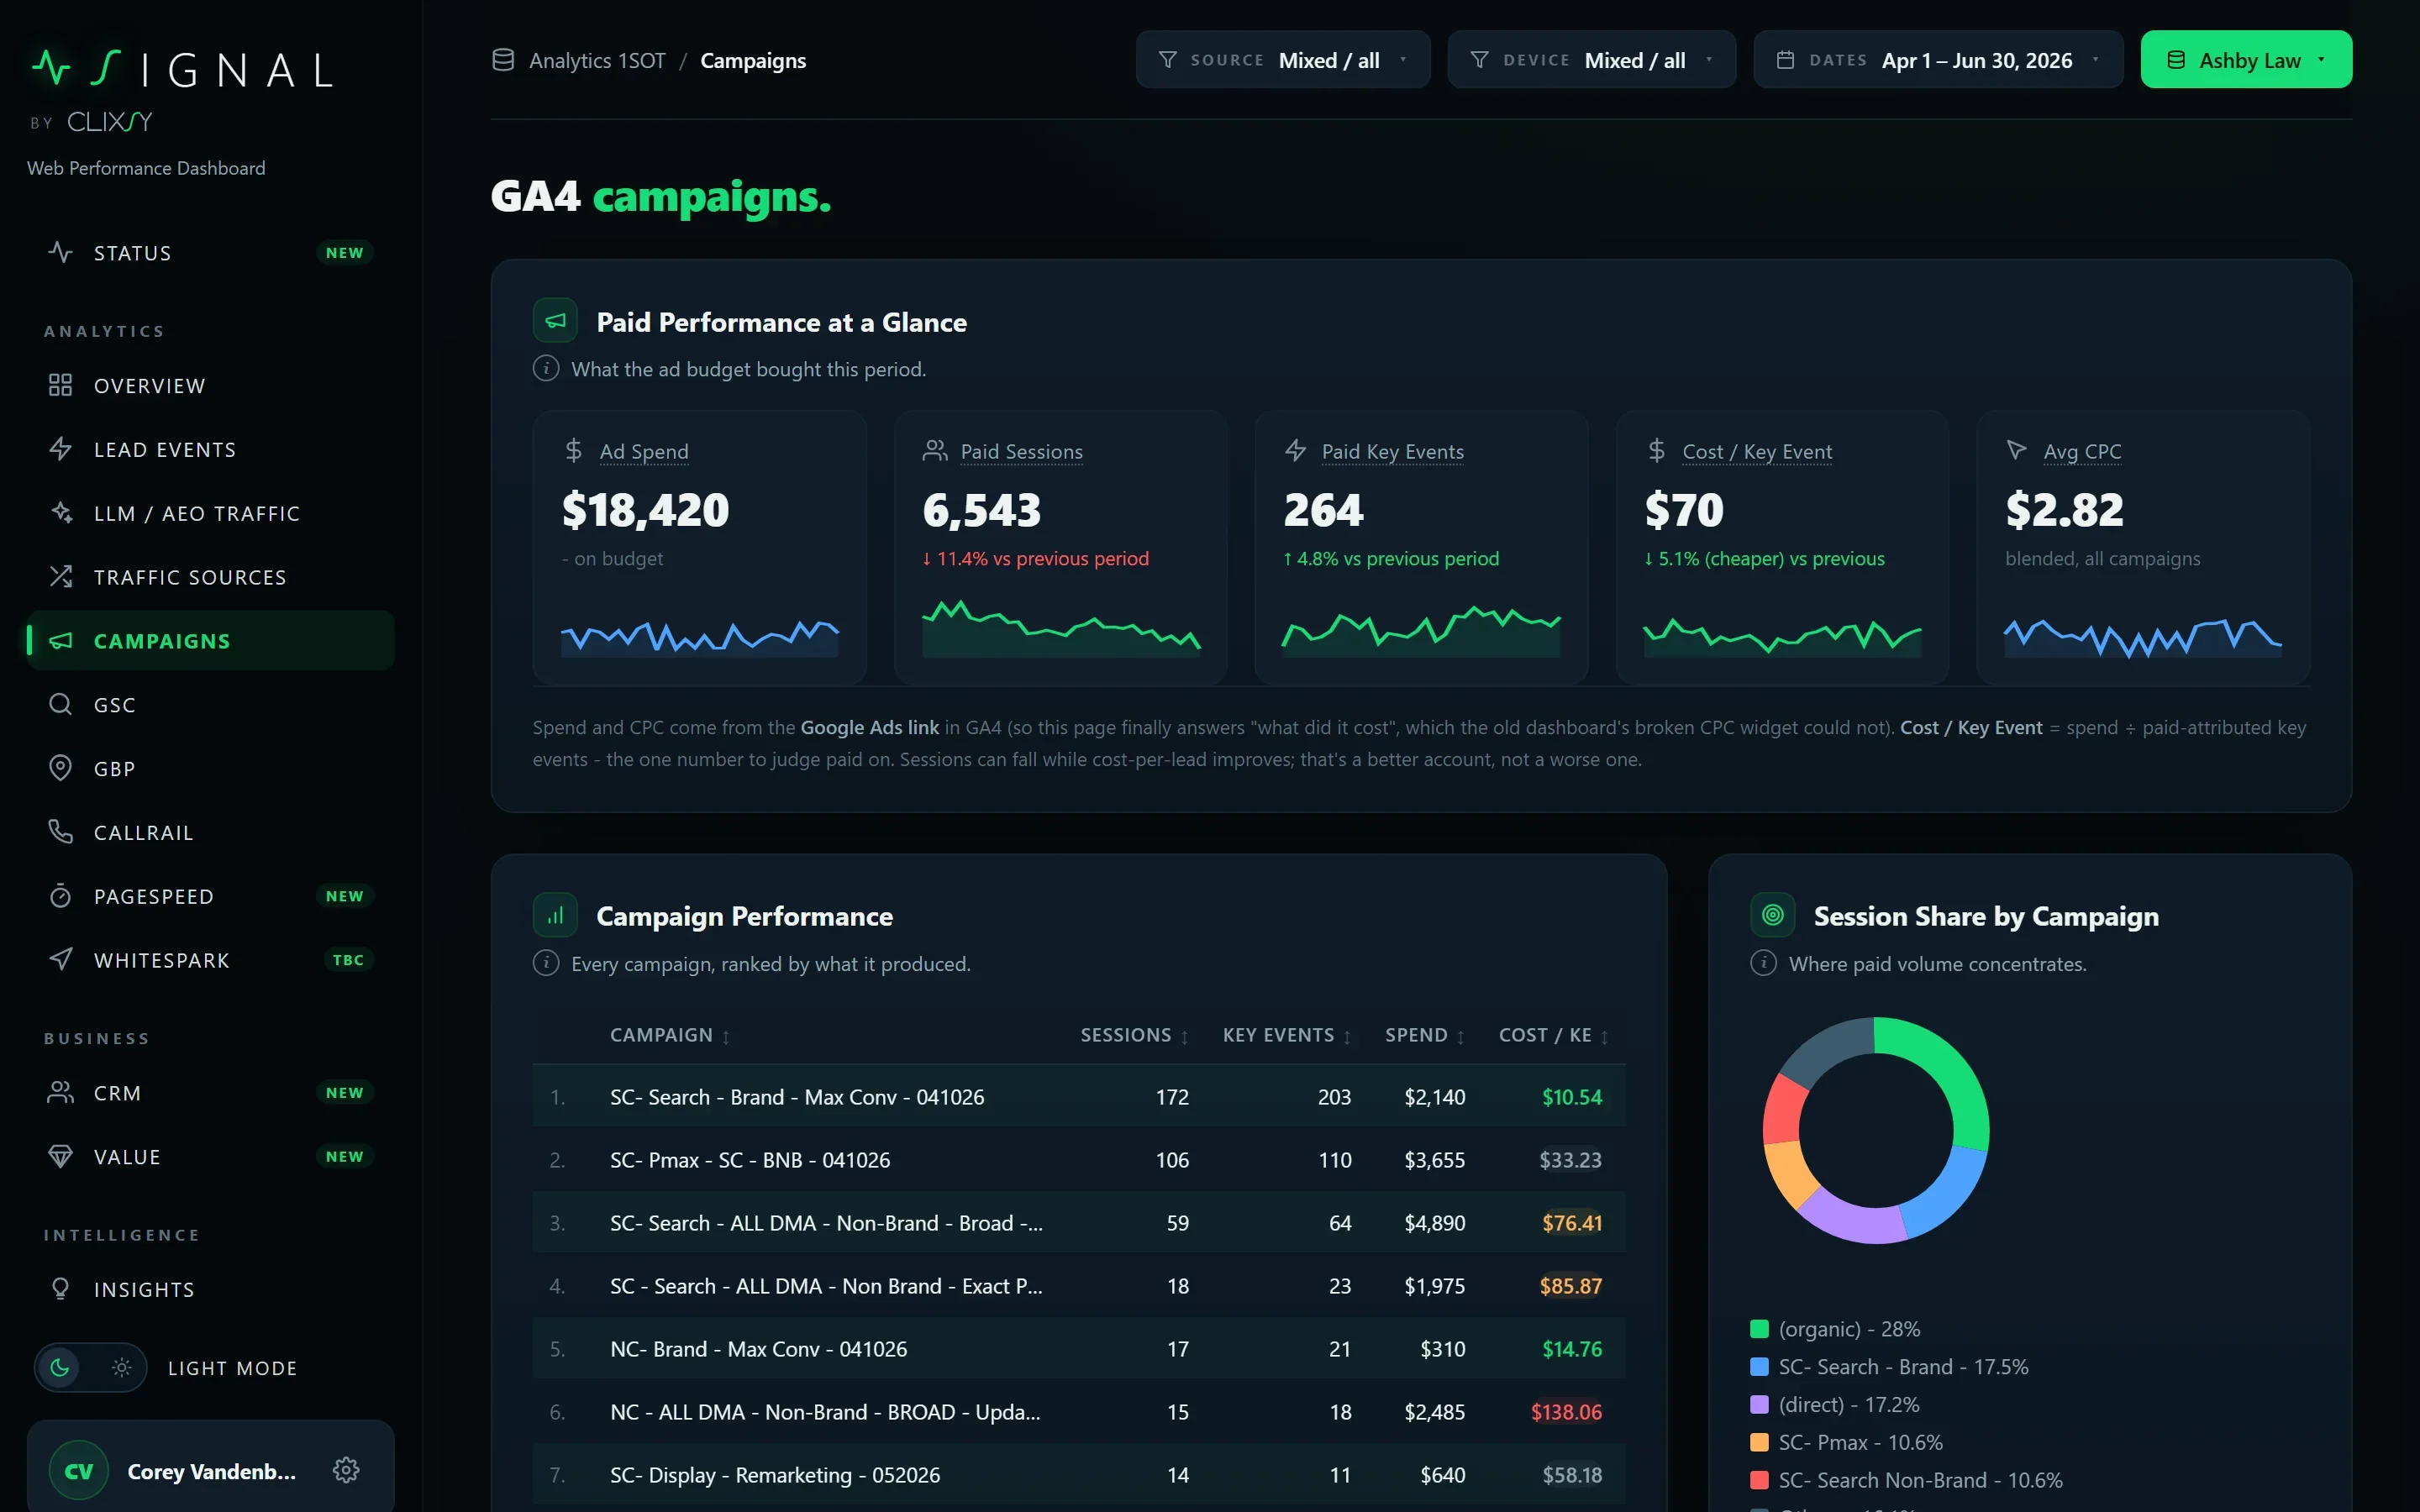
Every view shares the date range, the source and device filters, and the same definitions. Change the range once and all fourteen follow.

How it plugs in

Signal knows the account
before you open it.

It is one piece of the Clixsy ecosystem. The same events, the same hours and the same source of truth feed every tool we run.

01

Sentience knows the client

Targets, practice areas, markets and the wanted-case profile live in the wiki. Signal reads them, nobody retypes them.

02

Script sees the lead

One tag on every client site reports the same events to Signal, the GBP pipeline and Surge.

03

Signal joins the sources

GA4, Search Console, CallRail, GBP, Whitespark, PageSpeed and the CRM land in one warehouse with one set of definitions.

04

The client reads the answer

A verdict, the numbers behind it and the plain-English read. Technical details can be switched off for the clean view.

Questions

Fair questions.

Is the data live?

Each source lands on its own cadence and Signal shows it as soon as it does. GA4 and the pixel arrive daily, CallRail exports every few days, and Google Business Profile trails by about five days at the API. The dashboard says which is which, so a flat line is never mistaken for a missing feed.

Where do the definitions come from?

Every metric label carries its definition on hover, and every panel has a "how this is built" note listing the fields it reads. Turn technical details off and the notes disappear for the clean client view.

Does this replace the monthly report?

It replaces the deck. Deep-dive reports still ship when a question deserves one, built on the same data and marked Powered by Signal, so the numbers in the report and the numbers on the screen never argue.

Whose data is in the demo?

Nobody's. The screens on this page use a fictional firm with internally consistent demo numbers. Your dashboard shows your accounts and only your accounts.

Next step

See Signal on your numbers.

Forty-five minutes with the founder. We plug in your sources and read the verdict together. No pitch deck.